CAT 1996 — DILR Question 2
TablesEasy
Passage / Data
Direction: Answer the questions based on the following information.
The data given in the table shows the investment details in country ‘Fortune Land’ of companies A, B, C, D, E and F. Figures in the table are in US dollars in billions.
âââââââ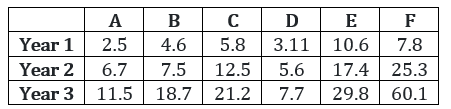 ââ
ââ
What is the ratio of investments of E to F for the years 1 to 3?
Answer & solution
- A
31 : 19
19 : 31
- C
20 : 29
- D
41 : 53
Solution
Company E’s investment for years 1 to 3
= 10.6 + 17.4 + 29.8 = 57.8
Company F’s investment for years 1 to 3
= 7.8 + 25.3 + 60.1 = 93.2
∴ Ratio = 57 : 93 = 19 : 31