CAT 1997 — DILR Question 21
Bar GraphsEasy
Passage / Data
Direction: Answer the questions based on the following graph.
The graph given below shows the quantity of milk and food grains consumed annually along with female and male population (in millions). Use the data to answer the questions that follow.
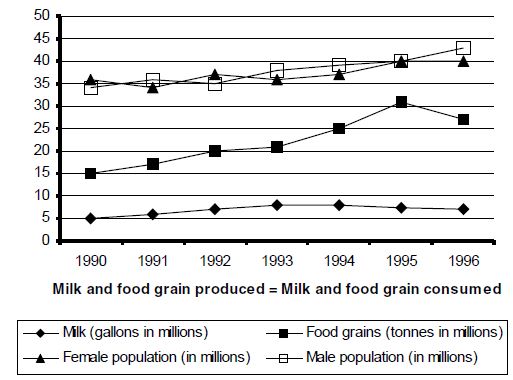
Referring to the above question, in which year was the per capita consumption of this nutrient highest?
Answer & solution
- A
1993
- B
1994
1995
- D
1996
Solution
 ââââââââââââââ
From the table, it is clear that the per capita consumption is maximum in 1995.