CAT 2003 Slot 1 — DILR Question 1
Bar GraphsEasy
Passage / Data
Answer the following question based on the information given below.
The length of an infant is one of the measures of his/her development in the early stages of his/her life. The figure below shows the growth chart of four infants in the first five months of life.
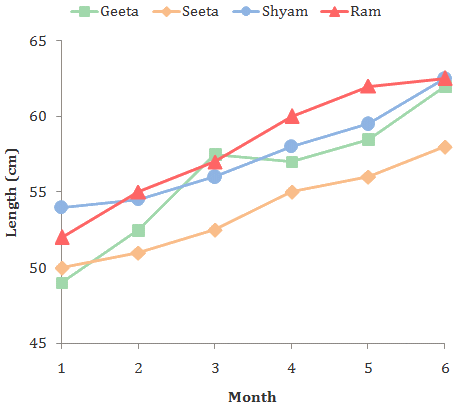
After which month did Seeta's rate of growth start to decline?
Answer & solution
Correct answer: Third month
- A
Second month
Third month
- C
Fourth month
- D
Never
Solution
It starts to decline after the 3rd month because the slope of the line depicting her development starts to decrease after the 3rd month.
Hence, option (b).
Related Bar Graphs questions
- Who grew at the fastest rate in the first two months of life?…
- The rate of growth during the third month was the lowest for ___.…
- Among the four infants, who grew the least in the first five months of life?…