CAT 2008 — DILR Question 5
Answer the following question based on the information given below.
The bar chart below shows the revenue received, in million US Dollars (USD), from subscribers to a particular Internet service. The data covers the period 2003 to 2007 for the United States (US) and Europe. The bar chart also shows the estimated revenues from subscription to this service for the period 2008 to 2010.
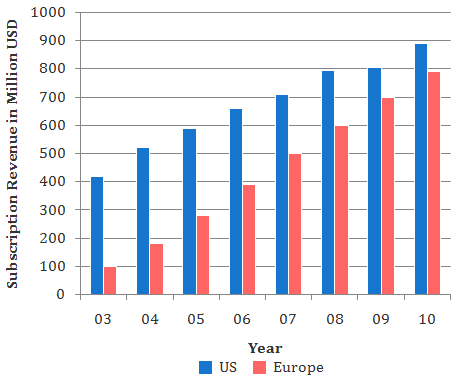
The difference between the estimated subscription in Europe in 2008 and what it would have been if it were computed using the percentage growth rate of 2007 (over 2006), is closest to:
Answer & solution
50
- B
80
- C
20
- D
10
- E
0
The estimated subscription revenue in Europe in 2008 = 605 million USD
The %growth rate in the revenue from 2006 to 2007 = × 100
∴ The compound subscription revenue in Europe in 2008 = 500 ×
= 500 × ≈ 658
∴ The difference between the estimated and the computed values = 658 – 605 = 53
The closest value among the given options is 50.
Hence, option (a).