CAT 2017 Slot 1 — DILR Question 8
Answer the following question based on the information given below.
A study to look at the early learning of rural kids was carried out in a number of villages spanning three states, chosen from the North East (NE), the West (W) and the South (S). 50 four-year old kids each were sampled from each of the 150 villages from NE, 250 villages from W and 200 villages from S. It was found that of the 30000 surveyed kids 55% studied in primary schools run by government (G), 37% in private schools (P) while the remaining 8% did not go to school (O).
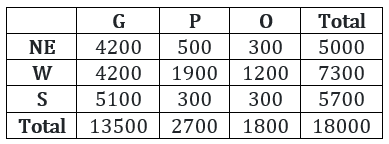
The kids surveyed were further divided into two groups based on whether their mothers dropped out of school before completing primary education or not. The table below gives the number of kids in different types of schools for mothers who dropped out of school before completing primary education:
 âââââââ
It is also known that:
- In S, 60% of the surveyed kids were in G. Moreover, in S, all surveyed kids whose mothers had completed primary education were in school.
- In NE, among the O kids, 50% had mothers who had dropped out before completing primary education.
- The number of kids in G in NE was the same as the number of kids in G in W.
In a follow up survey of the same kids two years later, it was found that all the kids were now in school. Of the kids who were not in school earlier, in one region, 25% were in G now, whereas the rest were enrolled in P; in the second region, all such kids were in G now; while in the third region, 50% of such kids had now joined G while the rest had joined P. As a result, in all three regions put together, 50% of the kids who were earlier out of school had joined G. It was also seen that no surveyed kid had changed schools.
What percentage of the surveyed kids in S, whose mothers had dropped out before completing primary education, were in G now?
Answer & solution
94.7%
- B
89.5%
- C
93.4%
- D
Cannot be determined from the given information
Consider the final table obtained in the solution to the first question.
 âââââââ
Now since 50% of 2400 i.e. 1200 kids were in G now and from one of the regions all had joined G, obviously it cannot ne from W, since in O in W region, there are 1500 kids. Also, if 25% of the kids from ‘O’ in the W region
it would mean that the 50% kids who joined G would have to be from NE or S region, which would mean that the total number of kids who joined G from O would never total upto 1200. So 50% of the kids from O in the W regions join G which means
kids from W region ‘O’join G. Now 100% of the kids from the NE, region in O (i.e., 600 kids) cannot join G as then total of the kids from the NE region in O (i.e., 600 kids) cannot join G as then total of the kids from ‘O’ region joining G region would exceed 1200.
This implies that 25% of the kids from the NE region in O
join G which means that 100% of the kids from S region in
'O' join G.
Number of mothers in S who dropped out = 5100 + 300 + 300 = 5700
Mothers who are in the ‘S’ region in G = 5100 + 300 = 5400
Percentage of mothers who are in the 'S' region in G = × 100 ≅ 94.7%
Hence, option (a).