CAT 2017 Slot 2 — DILR Question 7
Answer the following question based on the information given below.
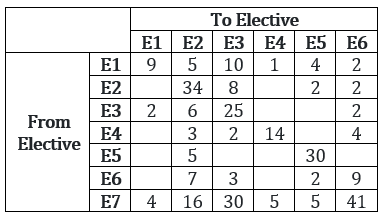
There were seven elective courses - E1 to E7 – running in a specific term in a college. Each of the 300 students enrolled had chosen just one elective from among these seven. However, before the start of the term, E7 was withdrawn as the instructor concerned had left the college. The students who had opted for E7 were allowed to join any of the remaining electives. Also, the students who had chosen other electives were given one chance to change their choice. The table below captures the movement of the students from one elective to another during this process. Movement from one elective to the same elective simply means no movement. Some numbers in the table got accidentally erased; however, it is known that these were either 0 or 1.
 âââââââ
Further, the following are known:
- Before the change process there were 6 more students in E1 than in E4, but after the reshuffle, the number of students in E4 was 3 more than that in E1.
- The number of students in E2 increased by 30 after the change process.
- Before the change process, E4 and 2 more students than E6, while E2 had 10 more students than E3.
After the change process, which course among E1 to E6 had the largest change in its enrollment as a percentage of its original enrollment?
Answer & solution
- A
E1
- B
E2
- C
E3
E6
Let us first try and tabulate the number of people for each of the electives before and after the change in elective
 âââââââ
ow we know that after change of electives number of people choosing E2 increases by 30. This means that before change of electives, number of people choosing E2 is 76 – 30 = 46.
Now if we check row E2, the values 34, 8, 2 and 2 add upto 46. Since the values of blank cells can be 0 or 1, it means that the remaining 2 cells in row E2 will be 0.
Now before the change, E1 had 6 more students than E4, which means E4 had 31 – 6 = 25 students. If we look at the row E4, there are 2 blank cells. Also, the total of the remaining 4 cells adds upto 3 + 2 + 14 + 4 = 23. As total of all 6 cells has to be 25, it would mean that remaining 2 cells can only have a value of 1. Also the number of students before change of elective in E6 is 25 – 2 = 23. Again in row E6, sum of 4 occupied cells = 7 + 3 + 2 + 9 = 21. Here too with only 2 vacant cells, the balance 2 cells will have a value of 1 each. Now in E2 there are 10 students more than E3 before change of electives, which means in row E3 the total will be 36. This further implies that in row E5, total will be 300 – (31 + 46 + 36 + 25 + 23 + 101) = 38
 âââââââ
So far, the total of columns E1 to E6 is 17 + 76 + 78 + 21 + 44 + 60 = 296
This means that the remaining 6 vacant cells in the table will be filled up four ‘1’s and two 0’s. Since the number of students after the reshuffle in E1 is 3 less than the number of students in E4 (which is 21 without the 2 blank cells), the total of column E1 has to be at least 18 which means the vacant cell in column E1 will be filled with 1. This further implies that the balance 2 cells in column E4 will be filled with 0. So then the remaining cells in column E3, E5 and E6 will be filled with 1. Our final table will appear as below.
 âââââââ
Now using this table let us answer the questions
As can be seen from the table above, the highest percentage is for E6.
 ââââââââââââââ
Hence, option (d).
Note: We do not need to calculate the exact value. If we compare the value of number of students in electives before and after change, we will see by observation that the ratio for E6 will be highest.