CAT 2021 Slot 1 — DILR Question 8
Answer the next 4 questions based on the information given
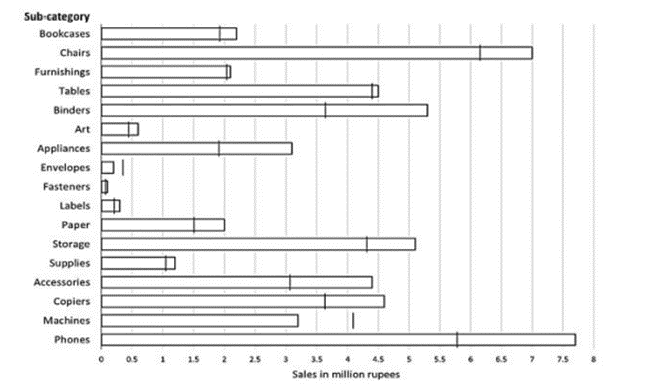
The horizontal bars in the above diagram represent 2020 aggregate sales (in â¹ million) of a company for the different subcategories of its products. The top four product subcategories (Bookcases, Chairs, Furnishings, Tables) belong to furniture product category; the bottom four product subcategories (Accessories, Copiers, Machines, Phones) belong to the technology product category while all other product subcategories belong to the office supply product category. For each of the product subcategories, there is a vertical line indicating the sales of the corresponding subcategory in 2019.
 âââââââ
The improvement index for a category is the maximum percentage increase in sales from 2019 to 2020 among any of its subcategories. The correct order of categories in increasing order of this improvement index is
Answer & solution
furniture, technology, office supply
- B
technology, furniture, office supply
- C
office supply, technology, furniture
- D
office supply, furniture, technology
In furniture category, Chairs subcategory has the highest % increase i.e., approx. 15%.
∴ Improvement index for furniture is 15%.
In office supply category, Appliances subcategory has the highest % increase i.e., approx. 60%.
∴ Improvement index for office supply is 60%.
In technology category, Accessories subcategory has the highest % increase i.e., approx. 40%.
∴ Improvement index for technology is 40%.
∴ Improvement index of Furniture < Technology < Office Supplies.
Hence, option (a).