CAT 2022 Slot 2 — DILR Question 13
Answer the next 5 questions based on the information given below:
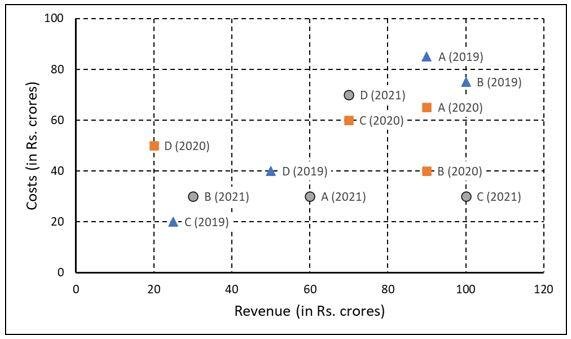
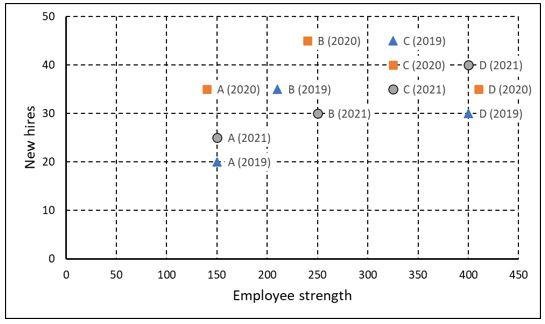
The two plots below show data for four companies code-named A, B, C, and D over three years - 2019, 2020, and 2021.
The first plot shows the revenues and costs incurred by the companies during these years. For example, in 2021, company C earned Rs.100 crores in revenue and spent Rs.30 crores. The profit of a company is defined as its revenue minus its costs.
The second plot shows the number of employees employed by the company (employee strength) at the start of each of these three years, as well as the number of new employees hired each year (new hires). For example, Company B had 250 employees at the start of 2021, and 30 new employees joined the company during the year.
The ratio of a company's annual profit to its annual costs is a measure of its performance. Which of the four companies had the lowest value of this ratio in 2019?
Answer & solution
Correct answer: Company A
- A
Company C
- B
Company B
- C
Company D
Company A
Consider the solution for first question of this set.
Ratio of (Annual profit) / (Annual Cost) in 2019 for
A = 5/85 = 1/17
B = 25/75 = 1/3
C = 5/20 = 1/4
D = 10/40 = ¼
This ratio is lowest for Company A.
Hence, option (a).
Related Bar Graphs questions
- Considering all three years, which company had the highest annual profit?…
- Which of the four companies experienced the highest annual loss in any of the ye…
- The total number of employees lost in 2019 and 2020 was the least for:…
- Profit per employee is the ratio of a company's profit to its employee strength.…