CAT 2025 Slot 2 — DILR Question 18
The Sustainability Index (SI) of a country at a point in time is an integer between 1 and 100. This question is related to SI of six countries – A, B, C, D, E, and F – at three different points in time – 2016, 2020, and 2024. The plot represents the exact changes in their SI, with X-coordinate representing % increase in 2020 from 2016, i.e., (SI in 2020 minus SI in 2016) / (SI in 2016), and Y-coordinate representing % increase in 2024 from 2020. At any point in time, the country with highest SI is ranked 1, while the country with the lowest SI is ranked 6. The following additional facts are known.
1. In 2016, B, C, E, and A had ranks 1, 2, 3, and 4 respectively.
2. F had lower SI than any other country in 2016, 2020, and 2024.
3. In 2024, E was the only country with SI of 90.
4. The range of SI of the six countries was 60 in 2016 as well as in 2024.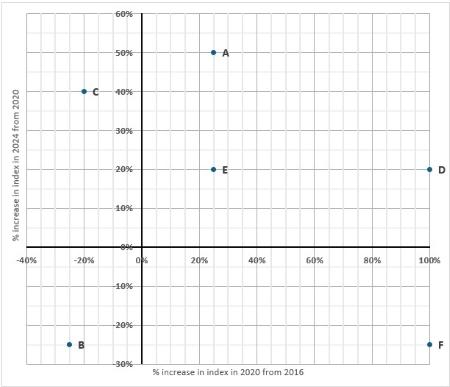
What was the SI of B in 2024?
Answer & solution
Correct answer: 45
- A54
- B60
- C80
- 45
Related Tables & Graphs questions
- What was the SI of E in 2016?…
- What was the SI of F in 2020?…
- What was the SI of C in 2024?…
- What was the total number of two-author and three-author papers written by Braje…
- Which of the following statements is/are NECESSARILY true? i. Chintan wrote exac…
- Which of the following statements is/are NECESSARILY true? i. Arman wrote three-…