Bar Graphs — CAT Previous-Year Questions
153 previous-year questions on Bar Graphs from CAT, with full solutions. Practise free — check answers as you go; sign in to save your progress.
Bar Graphs · CAT PYQs
Answer the following questions based on the information given.
The chart below shows the price data for seven shares – A, B, C, D, E, F, and G as a candlestick plot for a particular day. The vertical axis shows the price of the share in rupees. A share whose closing price (price at the end of the day) is more than its opening price (price at the start of the day) is called a bullish share; otherwise, it is called a bearish share. All bullish and bearish shares are shown in green and red colour respectively.

Reading the candles against the gridlines (each gridline = ₹200), the open / close / high / low values are approximately:
| Share | Open | Close | High | Low | Type |
|---|---|---|---|---|---|
| A | 2100 | 1900 | 2400 | 1500 | Bearish (red) |
| B | 2000 | 1750 | 2050 | 1300 | Bearish (red) |
| C | 850 | 1350 | 1400 | 750 | Bullish (green) |
| D | 600 | 1050 | 1150 | 300 | Bullish (green) |
| E | 1300 | 1150 | 1450 | 1100 | Bearish (red) |
| F | 1900 | 1700 | 2150 | 1650 | Bearish (red) |
| G | 1300 | 1750 | 1800 | 1250 | Bullish (green) |
For a red (bearish) candle the body top is the opening and the body bottom is the closing; for a green (bullish) candle the body bottom is the opening and the body top is the closing. The thin wicks mark the day’s high and low.
Daily Share Price Variability (SPV) is defined as (Day’s high price - Day’s low price) / (Average of the opening and closing prices during the day). Which among the shares A, C, D and F had the highest SPV on that day?
Answer the following questions based on the information given.
The chart below shows the price data for seven shares – A, B, C, D, E, F, and G as a candlestick plot for a particular day. The vertical axis shows the price of the share in rupees. A share whose closing price (price at the end of the day) is more than its opening price (price at the start of the day) is called a bullish share; otherwise, it is called a bearish share. All bullish and bearish shares are shown in green and red colour respectively.
Reading the candles against the gridlines (each gridline = ₹200), the open / close / high / low values are approximately:
| Share | Open | Close | High | Low | Type |
|---|---|---|---|---|---|
| A | 2100 | 1900 | 2400 | 1500 | Bearish (red) |
| B | 2000 | 1750 | 2050 | 1300 | Bearish (red) |
| C | 850 | 1350 | 1400 | 750 | Bullish (green) |
| D | 600 | 1050 | 1150 | 300 | Bullish (green) |
| E | 1300 | 1150 | 1450 | 1100 | Bearish (red) |
| F | 1900 | 1700 | 2150 | 1650 | Bearish (red) |
| G | 1300 | 1750 | 1800 | 1250 | Bullish (green) |
For a red (bearish) candle the body top is the opening and the body bottom is the closing; for a green (bullish) candle the body bottom is the opening and the body top is the closing. The thin wicks mark the day’s high and low.
Daily Share Price Variability (SPV) is defined as (Day’s high price - Day’s low price) / (Average of the opening and closing prices during the day). How many shares had an SPV greater than 0.5 on that day?
Answer the following questions based on the information given.
The chart below shows the price data for seven shares – A, B, C, D, E, F, and G as a candlestick plot for a particular day. The vertical axis shows the price of the share in rupees. A share whose closing price (price at the end of the day) is more than its opening price (price at the start of the day) is called a bullish share; otherwise, it is called a bearish share. All bullish and bearish shares are shown in green and red colour respectively.
Reading the candles against the gridlines (each gridline = ₹200), the open / close / high / low values are approximately:
| Share | Open | Close | High | Low | Type |
|---|---|---|---|---|---|
| A | 2100 | 1900 | 2400 | 1500 | Bearish (red) |
| B | 2000 | 1750 | 2050 | 1300 | Bearish (red) |
| C | 850 | 1350 | 1400 | 750 | Bullish (green) |
| D | 600 | 1050 | 1150 | 300 | Bullish (green) |
| E | 1300 | 1150 | 1450 | 1100 | Bearish (red) |
| F | 1900 | 1700 | 2150 | 1650 | Bearish (red) |
| G | 1300 | 1750 | 1800 | 1250 | Bullish (green) |
For a red (bearish) candle the body top is the opening and the body bottom is the closing; for a green (bullish) candle the body bottom is the opening and the body top is the closing. The thin wicks mark the day’s high and low.
Daily loss for a share is defined as (Opening price – Closing price) / (Opening price). Which among the shares A, B, F and G had the highest daily loss on that day?
Answer the following questions based on the information given.
The chart below shows the price data for seven shares – A, B, C, D, E, F, and G as a candlestick plot for a particular day. The vertical axis shows the price of the share in rupees. A share whose closing price (price at the end of the day) is more than its opening price (price at the start of the day) is called a bullish share; otherwise, it is called a bearish share. All bullish and bearish shares are shown in green and red colour respectively.
Reading the candles against the gridlines (each gridline = ₹200), the open / close / high / low values are approximately:
| Share | Open | Close | High | Low | Type |
|---|---|---|---|---|---|
| A | 2100 | 1900 | 2400 | 1500 | Bearish (red) |
| B | 2000 | 1750 | 2050 | 1300 | Bearish (red) |
| C | 850 | 1350 | 1400 | 750 | Bullish (green) |
| D | 600 | 1050 | 1150 | 300 | Bullish (green) |
| E | 1300 | 1150 | 1450 | 1100 | Bearish (red) |
| F | 1900 | 1700 | 2150 | 1650 | Bearish (red) |
| G | 1300 | 1750 | 1800 | 1250 | Bullish (green) |
For a red (bearish) candle the body top is the opening and the body bottom is the closing; for a green (bullish) candle the body bottom is the opening and the body top is the closing. The thin wicks mark the day’s high and low.
What would have been the percentage wealth gain for a trader, who bought equal numbers of all bullish shares at opening price and sold them at their day’s high?
Answer the next 5 questions based on the information given below:
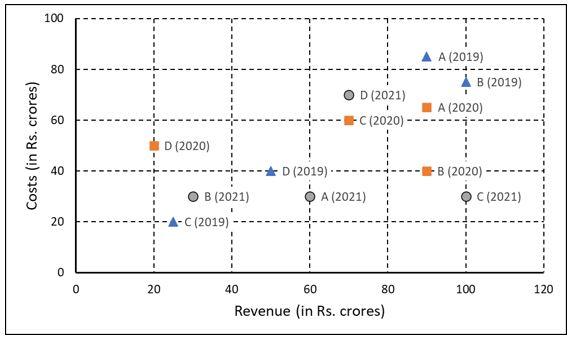
The two plots below show data for four companies code-named A, B, C, and D over three years - 2019, 2020, and 2021.
The first plot shows the revenues and costs incurred by the companies during these years. For example, in 2021, company C earned Rs.100 crores in revenue and spent Rs.30 crores. The profit of a company is defined as its revenue minus its costs.
 âââââââ
The second plot shows the number of employees employed by the company (employee strength) at the start of each of these three years, as well as the number of new employees hired each year (new hires). For example, Company B had 250 employees at the start of 2021, and 30 new employees joined the company during the year.
 âââââââ
Considering all three years, which company had the highest annual profit?
Answer the next 5 questions based on the information given below:
The two plots below show data for four companies code-named A, B, C, and D over three years - 2019, 2020, and 2021.
The first plot shows the revenues and costs incurred by the companies during these years. For example, in 2021, company C earned Rs.100 crores in revenue and spent Rs.30 crores. The profit of a company is defined as its revenue minus its costs.
âââââââ
The second plot shows the number of employees employed by the company (employee strength) at the start of each of these three years, as well as the number of new employees hired each year (new hires). For example, Company B had 250 employees at the start of 2021, and 30 new employees joined the company during the year.
âââââââ
Which of the four companies experienced the highest annual loss in any of the years?
Answer the next 5 questions based on the information given below:
The two plots below show data for four companies code-named A, B, C, and D over three years - 2019, 2020, and 2021.
The first plot shows the revenues and costs incurred by the companies during these years. For example, in 2021, company C earned Rs.100 crores in revenue and spent Rs.30 crores. The profit of a company is defined as its revenue minus its costs.
âââââââ
The second plot shows the number of employees employed by the company (employee strength) at the start of each of these three years, as well as the number of new employees hired each year (new hires). For example, Company B had 250 employees at the start of 2021, and 30 new employees joined the company during the year.
âââââââ
The ratio of a company's annual profit to its annual costs is a measure of its performance. Which of the four companies had the lowest value of this ratio in 2019?
Answer the next 5 questions based on the information given below:
The two plots below show data for four companies code-named A, B, C, and D over three years - 2019, 2020, and 2021.
The first plot shows the revenues and costs incurred by the companies during these years. For example, in 2021, company C earned Rs.100 crores in revenue and spent Rs.30 crores. The profit of a company is defined as its revenue minus its costs.
âââââââ
The second plot shows the number of employees employed by the company (employee strength) at the start of each of these three years, as well as the number of new employees hired each year (new hires). For example, Company B had 250 employees at the start of 2021, and 30 new employees joined the company during the year.
âââââââ
The total number of employees lost in 2019 and 2020 was the least for:
Answer the next 5 questions based on the information given below:
The two plots below show data for four companies code-named A, B, C, and D over three years - 2019, 2020, and 2021.
The first plot shows the revenues and costs incurred by the companies during these years. For example, in 2021, company C earned Rs.100 crores in revenue and spent Rs.30 crores. The profit of a company is defined as its revenue minus its costs.
âââââââ
The second plot shows the number of employees employed by the company (employee strength) at the start of each of these three years, as well as the number of new employees hired each year (new hires). For example, Company B had 250 employees at the start of 2021, and 30 new employees joined the company during the year.
âââââââ
Profit per employee is the ratio of a company's profit to its employee strength. For this purpose, the employee strength in a year is the average of the employee strength at the beginning of that year and the beginning of the next year. In 2020, which of the four companies had the highest profit per employee?
Answer the next 5 questions based on the information given below:
In the following, a year corresponds to 1st of January of that year.
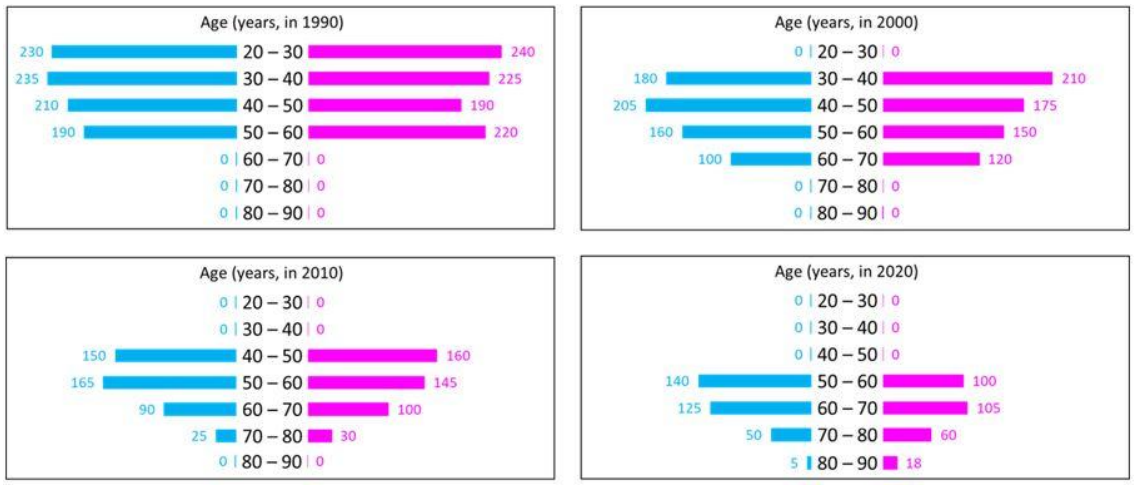
A study to determine the mortality rate for a disease began in 1980. The study chose 1000 males and 1000 females and followed them for forty years or until they died, whichever came first. The 1000 males chosen in 1980 consisted of 250 each of ages 10 to less than 20, 20 to less than 30, 30 to less than 40, and 40 to less than 50. The 1000 females chosen in 1980 also consisted of 250 each of ages 10 to less than 20, 20 to less than 30, 30 to less than 40, and 40 to less than 50.
The four figures below depict the age profile of those among the 2000 individuals who were still alive in 1990, 2000, 2010, and 2020. The blue bars in each figure represent the number of males in each age group at that point in time, while the pink bars represent the number of females in each age group at that point in time. The numbers next to the bars give the exact numbers being represented by the bars. For example, we know that 230 males among those tracked and who were alive in 1990 were aged between 20 and 30.
 âââââââ
In 2000, what was the ratio of the number of dead males to dead females among those being tracked?
Answer the next 5 questions based on the information given below:
In the following, a year corresponds to 1st of January of that year.
A study to determine the mortality rate for a disease began in 1980. The study chose 1000 males and 1000 females and followed them for forty years or until they died, whichever came first. The 1000 males chosen in 1980 consisted of 250 each of ages 10 to less than 20, 20 to less than 30, 30 to less than 40, and 40 to less than 50. The 1000 females chosen in 1980 also consisted of 250 each of ages 10 to less than 20, 20 to less than 30, 30 to less than 40, and 40 to less than 50.
The four figures below depict the age profile of those among the 2000 individuals who were still alive in 1990, 2000, 2010, and 2020. The blue bars in each figure represent the number of males in each age group at that point in time, while the pink bars represent the number of females in each age group at that point in time. The numbers next to the bars give the exact numbers being represented by the bars. For example, we know that 230 males among those tracked and who were alive in 1990 were aged between 20 and 30.
âââââââ
How many people who were being tracked and who were between 30 and 40 years of age in 1980 survived until 2010?
Answer the next 5 questions based on the information given below:
In the following, a year corresponds to 1st of January of that year.
A study to determine the mortality rate for a disease began in 1980. The study chose 1000 males and 1000 females and followed them for forty years or until they died, whichever came first. The 1000 males chosen in 1980 consisted of 250 each of ages 10 to less than 20, 20 to less than 30, 30 to less than 40, and 40 to less than 50. The 1000 females chosen in 1980 also consisted of 250 each of ages 10 to less than 20, 20 to less than 30, 30 to less than 40, and 40 to less than 50.
The four figures below depict the age profile of those among the 2000 individuals who were still alive in 1990, 2000, 2010, and 2020. The blue bars in each figure represent the number of males in each age group at that point in time, while the pink bars represent the number of females in each age group at that point in time. The numbers next to the bars give the exact numbers being represented by the bars. For example, we know that 230 males among those tracked and who were alive in 1990 were aged between 20 and 30.
âââââââ
How many individuals who were being tracked and who were less than 30 years of age in 1980 survived until 2020?
Answer the next 5 questions based on the information given below:
In the following, a year corresponds to 1st of January of that year.
A study to determine the mortality rate for a disease began in 1980. The study chose 1000 males and 1000 females and followed them for forty years or until they died, whichever came first. The 1000 males chosen in 1980 consisted of 250 each of ages 10 to less than 20, 20 to less than 30, 30 to less than 40, and 40 to less than 50. The 1000 females chosen in 1980 also consisted of 250 each of ages 10 to less than 20, 20 to less than 30, 30 to less than 40, and 40 to less than 50.
The four figures below depict the age profile of those among the 2000 individuals who were still alive in 1990, 2000, 2010, and 2020. The blue bars in each figure represent the number of males in each age group at that point in time, while the pink bars represent the number of females in each age group at that point in time. The numbers next to the bars give the exact numbers being represented by the bars. For example, we know that 230 males among those tracked and who were alive in 1990 were aged between 20 and 30.
âââââââ
How many of the males who were being tracked and who were between 20 and 30 yearsof age in 1980 died in the period 2000 to 2010?
Answer the next 5 questions based on the information given below:
In the following, a year corresponds to 1st of January of that year.
A study to determine the mortality rate for a disease began in 1980. The study chose 1000 males and 1000 females and followed them for forty years or until they died, whichever came first. The 1000 males chosen in 1980 consisted of 250 each of ages 10 to less than 20, 20 to less than 30, 30 to less than 40, and 40 to less than 50. The 1000 females chosen in 1980 also consisted of 250 each of ages 10 to less than 20, 20 to less than 30, 30 to less than 40, and 40 to less than 50.
The four figures below depict the age profile of those among the 2000 individuals who were still alive in 1990, 2000, 2010, and 2020. The blue bars in each figure represent the number of males in each age group at that point in time, while the pink bars represent the number of females in each age group at that point in time. The numbers next to the bars give the exact numbers being represented by the bars. For example, we know that 230 males among those tracked and who were alive in 1990 were aged between 20 and 30.
âââââââ
How many of the females who were being tracked and who were between 20 and 30 years of age in 1980 died between the ages of 50 and 60?
[Note: There is an ambiguity in this question and hence was discarded by IIM Bangalore.]
Answer the next 4 questions based on the information given
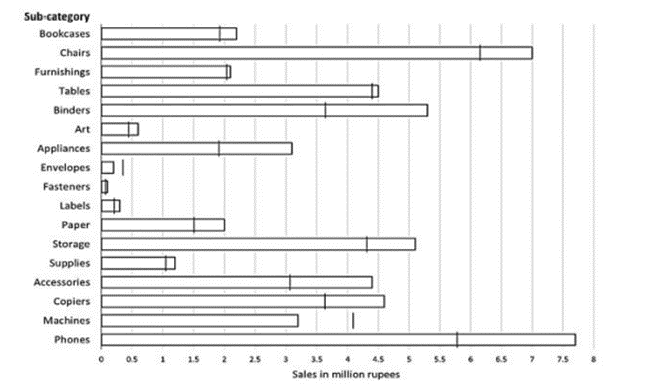
The horizontal bars in the above diagram represent 2020 aggregate sales (in â¹ million) of a company for the different subcategories of its products. The top four product subcategories (Bookcases, Chairs, Furnishings, Tables) belong to furniture product category; the bottom four product subcategories (Accessories, Copiers, Machines, Phones) belong to the technology product category while all other product subcategories belong to the office supply product category. For each of the product subcategories, there is a vertical line indicating the sales of the corresponding subcategory in 2019.
 âââââââ
The total sales (in â¹ million) in 2019 from products in office supplies category is closest to
Answer the next 4 questions based on the information given
The horizontal bars in the above diagram represent 2020 aggregate sales (in â¹ million) of a company for the different subcategories of its products. The top four product subcategories (Bookcases, Chairs, Furnishings, Tables) belong to furniture product category; the bottom four product subcategories (Accessories, Copiers, Machines, Phones) belong to the technology product category while all other product subcategories belong to the office supply product category. For each of the product subcategories, there is a vertical line indicating the sales of the corresponding subcategory in 2019.
âââââââ
The percentage increase in sales in Furniture category from 2019 to 2020 is closest to
Answer the next 4 questions based on the information given
The horizontal bars in the above diagram represent 2020 aggregate sales (in â¹ million) of a company for the different subcategories of its products. The top four product subcategories (Bookcases, Chairs, Furnishings, Tables) belong to furniture product category; the bottom four product subcategories (Accessories, Copiers, Machines, Phones) belong to the technology product category while all other product subcategories belong to the office supply product category. For each of the product subcategories, there is a vertical line indicating the sales of the corresponding subcategory in 2019.
âââââââ
How many subcategories had sales of â¹ 4 million or more in 2019 and registered an increase in sales in excess of 25% in 2020?
Answer the next 4 questions based on the information given
The horizontal bars in the above diagram represent 2020 aggregate sales (in â¹ million) of a company for the different subcategories of its products. The top four product subcategories (Bookcases, Chairs, Furnishings, Tables) belong to furniture product category; the bottom four product subcategories (Accessories, Copiers, Machines, Phones) belong to the technology product category while all other product subcategories belong to the office supply product category. For each of the product subcategories, there is a vertical line indicating the sales of the corresponding subcategory in 2019.
âââââââ
The improvement index for a category is the maximum percentage increase in sales from 2019 to 2020 among any of its subcategories. The correct order of categories in increasing order of this improvement index is
Answer the next 4 questions based on the information given
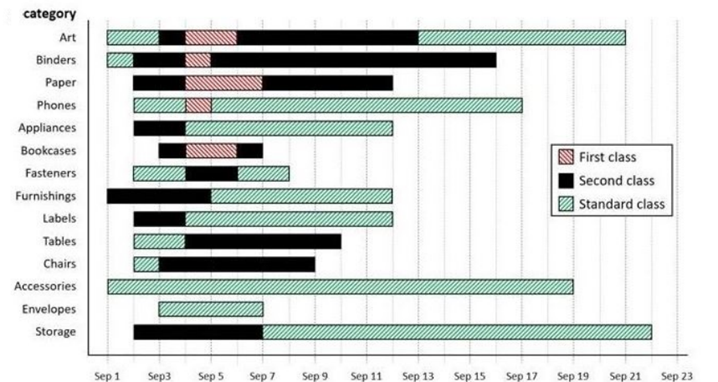
The different bars in the diagram above provide information about different orders in various categories (Art, Binders, ….) that were booked in the first two weeks of September of a store for one client. The colour and pattern of a bar denotes the ship mode (First Class / Second Class / Standard Class). The left end point of a bar indicates the booking day of the order, while the right end point indicates the dispatch day of the order. The difference between the dispatch day and the booking day (measured in terms of the number of days) is called the processing time of the order. For the same category, an order is considered for booking only after the previous order of the same category is dispatched. No two consecutive orders of the same category had identical ship mode during this period.
For example, there were only two orders in the furnishing category during this period. The first one was shipped in the Second Class. It was booked on Sep 1 and dispatched on Sep 5. The second order was shipped in the Standard class. It was booked on Sep 5 (although the order might have been placed before that) and dispatched on Sep 12. So the processing times were 4 and 7 days respectively for these orders.
 âââââââ
How many days between Sep 1 and Sep 14 (both inclusive) had no booking from this client considering all the above categories?
Answer the next 4 questions based on the information given
The different bars in the diagram above provide information about different orders in various categories (Art, Binders, ….) that were booked in the first two weeks of September of a store for one client. The colour and pattern of a bar denotes the ship mode (First Class / Second Class / Standard Class). The left end point of a bar indicates the booking day of the order, while the right end point indicates the dispatch day of the order. The difference between the dispatch day and the booking day (measured in terms of the number of days) is called the processing time of the order. For the same category, an order is considered for booking only after the previous order of the same category is dispatched. No two consecutive orders of the same category had identical ship mode during this period.
For example, there were only two orders in the furnishing category during this period. The first one was shipped in the Second Class. It was booked on Sep 1 and dispatched on Sep 5. The second order was shipped in the Standard class. It was booked on Sep 5 (although the order might have been placed before that) and dispatched on Sep 12. So the processing times were 4 and 7 days respectively for these orders.
âââââââ
What was the average processing time of all orders in the categories which had only one type of ship mode?
Answer the next 4 questions based on the information given
The different bars in the diagram above provide information about different orders in various categories (Art, Binders, ….) that were booked in the first two weeks of September of a store for one client. The colour and pattern of a bar denotes the ship mode (First Class / Second Class / Standard Class). The left end point of a bar indicates the booking day of the order, while the right end point indicates the dispatch day of the order. The difference between the dispatch day and the booking day (measured in terms of the number of days) is called the processing time of the order. For the same category, an order is considered for booking only after the previous order of the same category is dispatched. No two consecutive orders of the same category had identical ship mode during this period.
For example, there were only two orders in the furnishing category during this period. The first one was shipped in the Second Class. It was booked on Sep 1 and dispatched on Sep 5. The second order was shipped in the Standard class. It was booked on Sep 5 (although the order might have been placed before that) and dispatched on Sep 12. So the processing times were 4 and 7 days respectively for these orders.
âââââââ
The sequence of categories -- Art, Binders, Paper and Phones -- in decreasing order of average processing time of their orders in this period is:
Answer the next 4 questions based on the information given
The different bars in the diagram above provide information about different orders in various categories (Art, Binders, ….) that were booked in the first two weeks of September of a store for one client. The colour and pattern of a bar denotes the ship mode (First Class / Second Class / Standard Class). The left end point of a bar indicates the booking day of the order, while the right end point indicates the dispatch day of the order. The difference between the dispatch day and the booking day (measured in terms of the number of days) is called the processing time of the order. For the same category, an order is considered for booking only after the previous order of the same category is dispatched. No two consecutive orders of the same category had identical ship mode during this period.
For example, there were only two orders in the furnishing category during this period. The first one was shipped in the Second Class. It was booked on Sep 1 and dispatched on Sep 5. The second order was shipped in the Standard class. It was booked on Sep 5 (although the order might have been placed before that) and dispatched on Sep 12. So the processing times were 4 and 7 days respectively for these orders.
âââââââ
Approximately what percentage of orders had a processing time of one day during the period Sep 1 to Sep 22 (both dates inclusive)?
Answer the next 4 questions based on the information given
The figure above shows the schedule of four employees – Abani, Bahni, Danni and Tinni – whom Dhoni supervised in 2020. Altogether there were five projects which started and concluded in 2020 in which they were involved. For each of these projects and for each employee, the starting day was at the beginning of a month and the concluding day was the end of a month, and these are indicated by the left and right end points of the corresponding horizontal bars. The number within each bar indicates the percentage of assigned work completed by the employee for that project, as assessed by Dhoni.
For each employee, his/her total project-month (in 2020) is the sum of the number of months (s)he worked across the five project, while his/her annual completion index is the weightage average of the completion percentage assigned from the different projects, with the weights being the corresponding number of months (s)he worked in these projects. For each project, the total employee-month is the sum of the number of months four employees worked in this project, while its completion index is the weightage average of the completion percentage assigned for the employees who worked in this project, with the weights being the corresponding number of months they worked in this project.
 âââââââ
Which of the following statements is/are true?
I: The total project-month was the same for the four employees.
II: The total employee-month was the same for the five projects.
Answer the next 4 questions based on the information given
The figure above shows the schedule of four employees – Abani, Bahni, Danni and Tinni – whom Dhoni supervised in 2020. Altogether there were five projects which started and concluded in 2020 in which they were involved. For each of these projects and for each employee, the starting day was at the beginning of a month and the concluding day was the end of a month, and these are indicated by the left and right end points of the corresponding horizontal bars. The number within each bar indicates the percentage of assigned work completed by the employee for that project, as assessed by Dhoni.
For each employee, his/her total project-month (in 2020) is the sum of the number of months (s)he worked across the five project, while his/her annual completion index is the weightage average of the completion percentage assigned from the different projects, with the weights being the corresponding number of months (s)he worked in these projects. For each project, the total employee-month is the sum of the number of months four employees worked in this project, while its completion index is the weightage average of the completion percentage assigned for the employees who worked in this project, with the weights being the corresponding number of months they worked in this project.
âââââââ
Which employees did not work in multiple projects for any of the months in 2020?
Answer the next 4 questions based on the information given
The figure above shows the schedule of four employees – Abani, Bahni, Danni and Tinni – whom Dhoni supervised in 2020. Altogether there were five projects which started and concluded in 2020 in which they were involved. For each of these projects and for each employee, the starting day was at the beginning of a month and the concluding day was the end of a month, and these are indicated by the left and right end points of the corresponding horizontal bars. The number within each bar indicates the percentage of assigned work completed by the employee for that project, as assessed by Dhoni.
For each employee, his/her total project-month (in 2020) is the sum of the number of months (s)he worked across the five project, while his/her annual completion index is the weightage average of the completion percentage assigned from the different projects, with the weights being the corresponding number of months (s)he worked in these projects. For each project, the total employee-month is the sum of the number of months four employees worked in this project, while its completion index is the weightage average of the completion percentage assigned for the employees who worked in this project, with the weights being the corresponding number of months they worked in this project.
âââââââ
The project duration, measured in terms of the number of months, is the time during which at least one employee worked in the project. Which of the following pairs of the projects had the same duration?
Answer the next 4 questions based on the information given
The figure above shows the schedule of four employees – Abani, Bahni, Danni and Tinni – whom Dhoni supervised in 2020. Altogether there were five projects which started and concluded in 2020 in which they were involved. For each of these projects and for each employee, the starting day was at the beginning of a month and the concluding day was the end of a month, and these are indicated by the left and right end points of the corresponding horizontal bars. The number within each bar indicates the percentage of assigned work completed by the employee for that project, as assessed by Dhoni.
For each employee, his/her total project-month (in 2020) is the sum of the number of months (s)he worked across the five project, while his/her annual completion index is the weightage average of the completion percentage assigned from the different projects, with the weights being the corresponding number of months (s)he worked in these projects. For each project, the total employee-month is the sum of the number of months four employees worked in this project, while its completion index is the weightage average of the completion percentage assigned for the employees who worked in this project, with the weights being the corresponding number of months they worked in this project.
âââââââ
The list of employees in decreasing order of annual completion index is:
Answer the following question based on the information given below.
The Ministry of Home Affairs is analysing crimes committed by foreigners in different states and union territories (UT) of India. All cases refer to the ones registered against foreigners in 2016.
The number of cases – classified into three categories: IPC crimes, SLL crimes and other crimes – for nine states/UTs are shown in the figure below. These nine belong to the top ten states/UTs in terms of the total number of cases registered. The remaining state (among top ten) is West Bengal, where all the 520 cases registered were SLL crimes.

The table below shows the ranks of the ten states/UTs mentioned above among ALL states/UTs of India in terms of the number of cases registered in each of the three category of crimes. A state/UT is given rank r for a category of crimes if there are (r−1) states/UTs having a larger number of cases registered in that category of crimes. For example, if two states have the same number of cases in a category, and exactly three other states/UTs have larger numbers of cases registered in the same category, then both the states are given rank 4 in that category. Missing ranks in the table are denoted by *.
 âââââââ
What is the rank of Kerala in the ‘IPC crimes’ category?
Answer the following question based on the information given below.
The Ministry of Home Affairs is analysing crimes committed by foreigners in different states and union territories (UT) of India. All cases refer to the ones registered against foreigners in 2016.
The number of cases – classified into three categories: IPC crimes, SLL crimes and other crimes – for nine states/UTs are shown in the figure below. These nine belong to the top ten states/UTs in terms of the total number of cases registered. The remaining state (among top ten) is West Bengal, where all the 520 cases registered were SLL crimes.
The table below shows the ranks of the ten states/UTs mentioned above among ALL states/UTs of India in terms of the number of cases registered in each of the three category of crimes. A state/UT is given rank r for a category of crimes if there are (r−1) states/UTs having a larger number of cases registered in that category of crimes. For example, if two states have the same number of cases in a category, and exactly three other states/UTs have larger numbers of cases registered in the same category, then both the states are given rank 4 in that category. Missing ranks in the table are denoted by *.
âââââââ
What is the sum of the ranks of Delhi in the three categories of crimes?
Answer the following questions based on the information given below.
A large store has only three departments, Clothing, Produce, and Electronics. The following figure shows the percentages of revenue and cost from the three departments for the years 2016, 2017 and 2018. The dotted lines depict percentage levels. So for example, in 2016, 50% of store's revenue came from its Electronics department while 40% of its costs were incurred in the Produce department.

In this setup, Profit is computed as (Revenue – Cost) and Percentage Profit as Profit/Cost × 100%.
It is known that
- The percentage profit for the store in 2016 was 100%.
- The store’s revenue doubled from 2016 to 2017, and its cost doubled from 2016 to 2018.
- There was no profit from the Electronics department in 2017.
- In 2018, the revenue from the Clothing department was the same as the cost incurred in the Produce department.
What was the ratio of revenue generated from the Produce department in 2017 to that in 2018?
Answer the following questions based on the information given below.
A large store has only three departments, Clothing, Produce, and Electronics. The following figure shows the percentages of revenue and cost from the three departments for the years 2016, 2017 and 2018. The dotted lines depict percentage levels. So for example, in 2016, 50% of store's revenue came from its Electronics department while 40% of its costs were incurred in the Produce department.
In this setup, Profit is computed as (Revenue – Cost) and Percentage Profit as Profit/Cost × 100%.
It is known that
- The percentage profit for the store in 2016 was 100%.
- The store’s revenue doubled from 2016 to 2017, and its cost doubled from 2016 to 2018.
- There was no profit from the Electronics department in 2017.
- In 2018, the revenue from the Clothing department was the same as the cost incurred in the Produce department.
What was the percentage profit of the store in 2018?
Answer the following questions based on the information given below.
A large store has only three departments, Clothing, Produce, and Electronics. The following figure shows the percentages of revenue and cost from the three departments for the years 2016, 2017 and 2018. The dotted lines depict percentage levels. So for example, in 2016, 50% of store's revenue came from its Electronics department while 40% of its costs were incurred in the Produce department.
In this setup, Profit is computed as (Revenue – Cost) and Percentage Profit as Profit/Cost × 100%.
It is known that
- The percentage profit for the store in 2016 was 100%.
- The store’s revenue doubled from 2016 to 2017, and its cost doubled from 2016 to 2018.
- There was no profit from the Electronics department in 2017.
- In 2018, the revenue from the Clothing department was the same as the cost incurred in the Produce department.
What percentage of the total profits for the store in 2016 was from the Electronics department?
Answer the following questions based on the information given below.
A large store has only three departments, Clothing, Produce, and Electronics. The following figure shows the percentages of revenue and cost from the three departments for the years 2016, 2017 and 2018. The dotted lines depict percentage levels. So for example, in 2016, 50% of store's revenue came from its Electronics department while 40% of its costs were incurred in the Produce department.
In this setup, Profit is computed as (Revenue – Cost) and Percentage Profit as Profit/Cost × 100%.
It is known that
- The percentage profit for the store in 2016 was 100%.
- The store’s revenue doubled from 2016 to 2017, and its cost doubled from 2016 to 2018.
- There was no profit from the Electronics department in 2017.
- In 2018, the revenue from the Clothing department was the same as the cost incurred in the Produce department.
What was the approximate difference in profit percentages of the store in 2017 and 2018?
Answer the following question based on the information given below.
Simple Happiness index (SHI) of a country is computed on the basis of three parameters: social support (S), freedom to life choices (F) and corruption perception (C). Each of these three parameters is measured on a scale of 0 to 8 (integers only). A country is then categorized based on the total score obtained by summing the scores of all the three parameters, as shown in the following table:
 âââââââ
Following diagram depicts the frequency distribution of the scores in S, F and C of 10 countries – Amda, Benga, Calla, Delma, Eppa, Varsa, Wanna, Xanda, Yanga and Zooma:
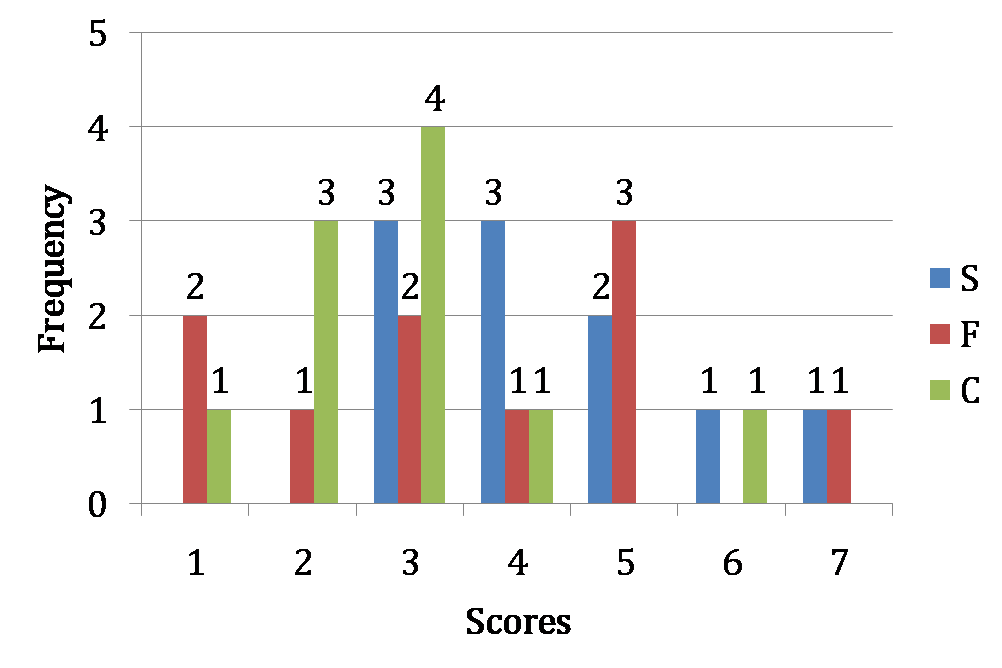
Further, the following are known:
- Amda and Calla jointly have the lowest total score, 7, with identical scores in all the three parameters.
- Zooma has a total score of 17.
- All the 3 countries, which are categorized as happy, have the highest score in exactly one parameter.
What is Amda's score in F?
Answer the following question based on the information given below.
Simple Happiness index (SHI) of a country is computed on the basis of three parameters: social support (S), freedom to life choices (F) and corruption perception (C). Each of these three parameters is measured on a scale of 0 to 8 (integers only). A country is then categorized based on the total score obtained by summing the scores of all the three parameters, as shown in the following table:
âââââââ
Following diagram depicts the frequency distribution of the scores in S, F and C of 10 countries – Amda, Benga, Calla, Delma, Eppa, Varsa, Wanna, Xanda, Yanga and Zooma:
Further, the following are known:
- Amda and Calla jointly have the lowest total score, 7, with identical scores in all the three parameters.
- Zooma has a total score of 17.
- All the 3 countries, which are categorized as happy, have the highest score in exactly one parameter.
What is Zooma’s score in S?
Answer the following question based on the information given below.
Simple Happiness index (SHI) of a country is computed on the basis of three parameters: social support (S), freedom to life choices (F) and corruption perception (C). Each of these three parameters is measured on a scale of 0 to 8 (integers only). A country is then categorized based on the total score obtained by summing the scores of all the three parameters, as shown in the following table:
âââââââ
Following diagram depicts the frequency distribution of the scores in S, F and C of 10 countries – Amda, Benga, Calla, Delma, Eppa, Varsa, Wanna, Xanda, Yanga and Zooma:
Further, the following are known:
- Amda and Calla jointly have the lowest total score, 7, with identical scores in all the three parameters.
- Zooma has a total score of 17.
- All the 3 countries, which are categorized as happy, have the highest score in exactly one parameter.
Benga and Delma, two countries categorized as happy, are tied with the same total score. What is the maximum score they can have?
Answer the following question based on the information given below.
Simple Happiness index (SHI) of a country is computed on the basis of three parameters: social support (S), freedom to life choices (F) and corruption perception (C). Each of these three parameters is measured on a scale of 0 to 8 (integers only). A country is then categorized based on the total score obtained by summing the scores of all the three parameters, as shown in the following table:
âââââââ
Following diagram depicts the frequency distribution of the scores in S, F and C of 10 countries – Amda, Benga, Calla, Delma, Eppa, Varsa, Wanna, Xanda, Yanga and Zooma:
Further, the following are known:
- Amda and Calla jointly have the lowest total score, 7, with identical scores in all the three parameters.
- Zooma has a total score of 17.
- All the 3 countries, which are categorized as happy, have the highest score in exactly one parameter.
If Benga scores 16 and Delma scores 15, then what is the maximum number of countries with a score of 13?
Answer the following question based on the information given below.
The bar chart below shows the revenue received, in million US Dollars (USD), from subscribers to a particular Internet service. The data covers the period 2003 to 2007 for the United States (US) and Europe. The bar chart also shows the estimated revenues from subscription to this service for the period 2008 to 2010.
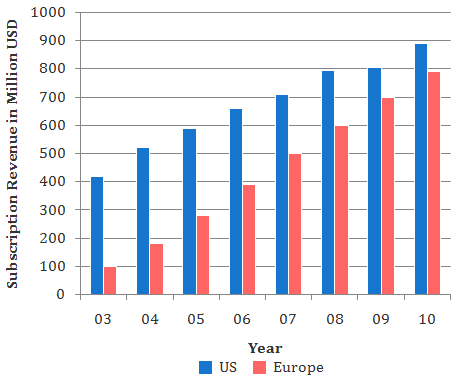
While the subscription in Europe has been growing steadily towards that of the US, the growth rate in Europe seems to be declining. Which of the following is closest to the percent change in growth rate of 2007 (over 2006) relative to the growth rate of 2005 (over 2004)?
Answer the following question based on the information given below.
The bar chart below shows the revenue received, in million US Dollars (USD), from subscribers to a particular Internet service. The data covers the period 2003 to 2007 for the United States (US) and Europe. The bar chart also shows the estimated revenues from subscription to this service for the period 2008 to 2010.
The difference between the estimated subscription in Europe in 2008 and what it would have been if it were computed using the percentage growth rate of 2007 (over 2006), is closest to:
Answer the following question based on the information given below.
The bar chart below shows the revenue received, in million US Dollars (USD), from subscribers to a particular Internet service. The data covers the period 2003 to 2007 for the United States (US) and Europe. The bar chart also shows the estimated revenues from subscription to this service for the period 2008 to 2010.
In 2003, sixty percent of subscribers in Europe were men. Given that woman subscribers increase at the rate of 10 percent per annum and men at the rate of 5 percent per annum, what is the approximate percentage growth of subscribers between 2003 and 2010 in Europe? The subscription prices are volatile and may change each year.
Answer the following question based on the information given below.
The bar chart below shows the revenue received, in million US Dollars (USD), from subscribers to a particular Internet service. The data covers the period 2003 to 2007 for the United States (US) and Europe. The bar chart also shows the estimated revenues from subscription to this service for the period 2008 to 2010.
Consider the annual percent change in the gap between subscription revenues in the US and Europe. What is the year in which the absolute value of this change is the highest?
Answer the following question based on the information given below.
A management institute was established on January 1, 2000 with 3, 4, 5, and 6 faculty members in the Marketing, Organisational Behaviour (OB), Finance, and Operations Management (OM) areas respectively, to start with. No faculty member retired or joined the institute in the first three months of the year 2000. In the next four years, the institute recruited one faculty member in each of the four areas. All these new faculty members, who joined the institute subsequently over the years, were 25 years old at the time of their joining the institute. All of them joined the institute on April 1. During these four years, one of the faculty members retired at the age of 60. The following diagram gives the area-wise average age (in terms of number of completed years) of faculty members as on April 1 of 2000, 2001, 2002, and 2003.

From which area did the faculty member retire?
Answer the following question based on the information given below.
A management institute was established on January 1, 2000 with 3, 4, 5, and 6 faculty members in the Marketing, Organisational Behaviour (OB), Finance, and Operations Management (OM) areas respectively, to start with. No faculty member retired or joined the institute in the first three months of the year 2000. In the next four years, the institute recruited one faculty member in each of the four areas. All these new faculty members, who joined the institute subsequently over the years, were 25 years old at the time of their joining the institute. All of them joined the institute on April 1. During these four years, one of the faculty members retired at the age of 60. The following diagram gives the area-wise average age (in terms of number of completed years) of faculty members as on April 1 of 2000, 2001, 2002, and 2003.
Professors Naresh and Devesh, two faculty members in the Marketing area, who have been with the Institute since its inception, share a birthday, which falls on 20th November. One was born in 1947 and the other one in 1950. On April 1 2005, what was the age of the third faculty member who has been in the same area since inception?
Answer the following question based on the information given below.
A management institute was established on January 1, 2000 with 3, 4, 5, and 6 faculty members in the Marketing, Organisational Behaviour (OB), Finance, and Operations Management (OM) areas respectively, to start with. No faculty member retired or joined the institute in the first three months of the year 2000. In the next four years, the institute recruited one faculty member in each of the four areas. All these new faculty members, who joined the institute subsequently over the years, were 25 years old at the time of their joining the institute. All of them joined the institute on April 1. During these four years, one of the faculty members retired at the age of 60. The following diagram gives the area-wise average age (in terms of number of completed years) of faculty members as on April 1 of 2000, 2001, 2002, and 2003.
In which year did the new faculty member join the Finance area?
Answer the following question based on the information given below.
The length of an infant is one of the measures of his/her development in the early stages of his/her life. The figure below shows the growth chart of four infants in the first five months of life.
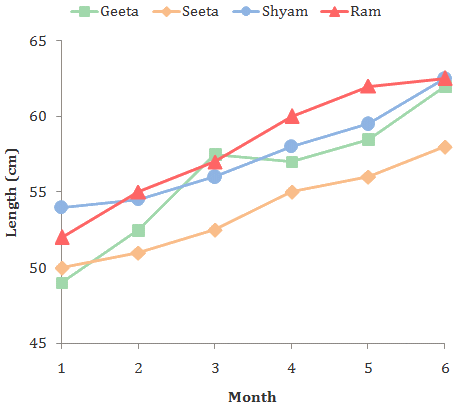
After which month did Seeta's rate of growth start to decline?
Answer the following question based on the information given below.
The length of an infant is one of the measures of his/her development in the early stages of his/her life. The figure below shows the growth chart of four infants in the first five months of life.
Who grew at the fastest rate in the first two months of life?
Answer the following question based on the information given below.
The length of an infant is one of the measures of his/her development in the early stages of his/her life. The figure below shows the growth chart of four infants in the first five months of life.
The rate of growth during the third month was the lowest for ___.
Answer the following question based on the information given below.
The length of an infant is one of the measures of his/her development in the early stages of his/her life. The figure below shows the growth chart of four infants in the first five months of life.
Among the four infants, who grew the least in the first five months of life?
Answer the following question based on the information given below.
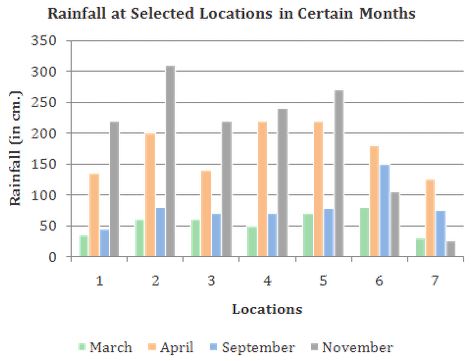
Answer the questions on the basis of the data presented in the figure below.
Which of the following statements is correct?
Answer the following question based on the information given below.
Answer the questions on the basis of the data presented in the figure below.
Locations 6 and 7 differ from all the rest because only in these two locations,
Answer the following question based on the information given below.
Answer the questions on the basis of the data presented in the figure below.

During 1996-2002, the number of commodities that exhibited a net overall increase and a net overall decrease, respectively, were
Answer the following question based on the information given below.
Answer the questions on the basis of the data presented in the figure below.
The number of commodities that experienced a price decline for two or more consecutive years is
Answer the following question based on the information given below.
Answer the questions on the basis of the data presented in the figure below.
For which commodities did a price increase immediately follow a price decline only once in this period?
Answer the following question based on the information given below.
The chart given below indicates the annual sales tax revenue collections (in crores of rupees) of seven states from 1996 to 2001.
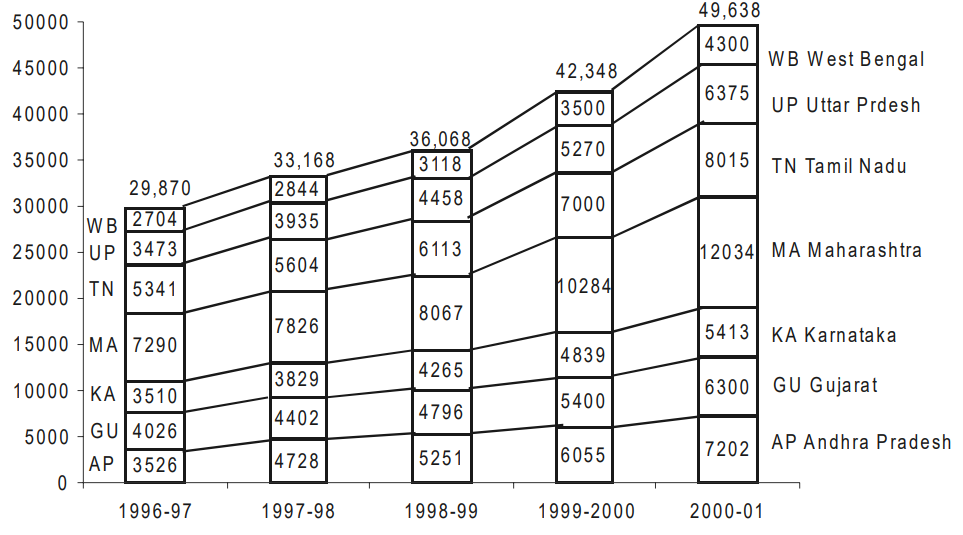
If for each year, the states are ranked in terms of descending order of sales tax collections, then how many states don't change their ranking more than once over the five years?
Answer the following question based on the information given below.
The chart given below indicates the annual sales tax revenue collections (in crores of rupees) of seven states from 1996 to 2001.
Which of the following states has changed its relative ranking most number of times when you rank the states in terms of the descending volume of sales tax collections each year?
Answer the following question based on the information given below.
The chart given below indicates the annual sales tax revenue collections (in crores of rupees) of seven states from 1996 to 2001.
The percentage share of sales tax revenue of which state has increased from 1997 to 2001?
Answer the following question based on the information given below.
The chart given below indicates the annual sales tax revenue collections (in crores of rupees) of seven states from 1996 to 2001.
Which pair of successive years shows the maximum growth rate of tax revenue in Maharashtra?
Answer the following question based on the information given below.
The chart given below indicates the annual sales tax revenue collections (in crores of rupees) of seven states from 1996 to 2001.
Identify the state whose tax revenue increased exactly by the same amount in two successive pair of years?
Answer the following question based on the information given below.
The chart given below indicates the annual sales tax revenue collections (in crores of rupees) of seven states from 1996 to 2001.
Which state below has been maintaining a constant rank over the years in terms of its contribution to the total tax collections?
Answer the following question based on the information given below.
There are six companies, 1 through 6. All of these companies use six operations, A through F. The following graph shows the distribution of efforts put in by each company in these six operations.

Suppose effort allocation is interchanged between operation B and C, then C and D, and then D and E. If companies are then ranked in ascending order of effort in E, what will be the rank of company 3?
Answer the following question based on the information given below.
There are six companies, 1 through 6. All of these companies use six operations, A through F. The following graph shows the distribution of efforts put in by each company in these six operations.
A new technology is introduced in company 4 such that the total efforts for operations B through F get evenly distributed among these. What is the change in the percentage of effort in operation E?
Answer the following question based on the information given below.
There are six companies, 1 through 6. All of these companies use six operations, A through F. The following graph shows the distribution of efforts put in by each company in these six operations.
Suppose the companies find that they can remove operations B, C and D and redistribute the effort released equally among the remaining operations. Then, which operation will show the maximum across all companies and all operations?
Answer the following question based on the information given below.
Information Technology Industry in India (Figure are in million US dollars)
 âââââââ
The total annual exports lay between 35 and 40 percent of the total annual business of the IT industry, in years
Answer the following question based on the information given below.
Information Technology Industry in India (Figure are in million US dollars)
âââââââ
The highest percentage growth in the total IT business, relative to the previous year was achieved in
Answer the following question based on the information given below.
Information Technology Industry in India (Figure are in million US dollars)
âââââââ
Which one of the following statements is correct?
Answer the following question based on the information given below.
Information Technology Industry in India (Figure are in million US dollars)
âââââââ
For the IT hardware business activity, which one of the following is not true?
Answer the following question based on the information given below.
Information Technology Industry in India (Figure are in million US dollars)
âââââââ
For the two IT business activities, hardware and peripherals, which one of the following is true?
FEI for a country in a year, is the ratio (expressed as a percentage) of its foreign equity inflows to its GDP. The following figure displays the FEIs for select Asian countries for the years 1997 and 1998.

The country with the largest change in FEI in 1998 relative to its FEI in 1997, is
FEI for a country in a year, is the ratio (expressed as a percentage) of its foreign equity inflows to its GDP. The following figure displays the FEIs for select Asian countries for the years 1997 and 1998.
Based on the data provided, it can be concluded that
FEI for a country in a year, is the ratio (expressed as a percentage) of its foreign equity inflows to its GDP. The following figure displays the FEIs for select Asian countries for the years 1997 and 1998.
It is known that China’s GDP in 1998 was 7% higher than its value in 1997, while India's GDP grew by 2% during the same period. The GDP of South Korea, on the other hand, fell by 5%. Which of the following statements is/are true?
- Foreign equity inflows to China were higher in 1998 than in 1997.
- Foreign equity inflows to China were lower in 1998 than in 1997.
- Foreign equity inflows to India were higher in 1998 than in 1997.
- Foreign equity inflows to South Korea decreased in 1998 relative to 1997.
- Foreign equity inflows to South Korea increased in 1998 relative to 1997.
FEI for a country in a year, is the ratio (expressed as a percentage) of its foreign equity inflows to its GDP. The following figure displays the FEIs for select Asian countries for the years 1997 and 1998.
China’s foreign equity inflows in 1998 were 10 times that into India. It can be concluded that
Answer the following question based on the information given below.
The table shows trends in external transactions of Indian corporate sector during the period 1993-94 to 1997-98. In addition, following definitions hold good.
Salesi , Importsi, and Exportsi respectively denote the sales, imports and exports in year i.
Deficit in year i, Deficiti = Importsi – Exportsi.
Deficit Intensity in year i, DIi = Deficiti / Salesi.
Growth rate of deficit intensity in year i, GDIi = (DIi – DIi-1)/DIi-1
Further, note that all imports are classified as either raw material or capital goods.
Trends in External Transactions of Indian Corporate Sector (All figures in %)
 âââââââ
The highest growth rate in deficit intensity was recorded in
Answer the following question based on the information given below.
The figures below present annual growth rate, expressed as the % change relative to the previous year, in four sectors of the economy of the Republic of Reposia during the 9 year period from 1990 to 1998. Assume that the index of production for each of the four sectors is set at 100 in 1989. Further, the four sectors manufacturing, mining and quarrying, electricity, and chemicals, respectively, constituted 20%. 15%. 10% and 15% of total industrial production in 1989.

Which is the sector with the highest growth during the period 1989 and 1998?
Answer the following question based on the information given below.
The figures below present annual growth rate, expressed as the % change relative to the previous year, in four sectors of the economy of the Republic of Reposia during the 9 year period from 1990 to 1998. Assume that the index of production for each of the four sectors is set at 100 in 1989. Further, the four sectors manufacturing, mining and quarrying, electricity, and chemicals, respectively, constituted 20%. 15%. 10% and 15% of total industrial production in 1989.
The overall growth rate in 1991 of the four sectors together is approximately
Answer the following question based on the information given below.
The figures below present annual growth rate, expressed as the % change relative to the previous year, in four sectors of the economy of the Republic of Reposia during the 9 year period from 1990 to 1998. Assume that the index of production for each of the four sectors is set at 100 in 1989. Further, the four sectors manufacturing, mining and quarrying, electricity, and chemicals, respectively, constituted 20%. 15%. 10% and 15% of total industrial production in 1989.
When was the highest level of production in the manufacturing sector achieved during the nine year period 1990-1998?
Answer the following question based on the information given below.
The figures below present annual growth rate, expressed as the % change relative to the previous year, in four sectors of the economy of the Republic of Reposia during the 9 year period from 1990 to 1998. Assume that the index of production for each of the four sectors is set at 100 in 1989. Further, the four sectors manufacturing, mining and quarrying, electricity, and chemicals, respectively, constituted 20%. 15%. 10% and 15% of total industrial production in 1989.
When was the lowest level of production of the mining and quarrying sector achieved during the nine year period 1990-1998?
Answer the following question based on the information given below.
The figures below present annual growth rate, expressed as the % change relative to the previous year, in four sectors of the economy of the Republic of Reposia during the 9 year period from 1990 to 1998. Assume that the index of production for each of the four sectors is set at 100 in 1989. Further, the four sectors manufacturing, mining and quarrying, electricity, and chemicals, respectively, constituted 20%. 15%. 10% and 15% of total industrial production in 1989.
The percentage increase of production in the four sectors, namely, manufacturing, mining & quarrying, electricity and chemicals, taken together, in 1994, relative to 1989, is approximately
Answer the following question based on the information given below.
ABC Ltd. produces widgets for which the demand is unlimited and they can sell all of their production. The graph below describes the monthly variable costs incurred by the company as a function of the quantity produced. In addition, operating the plant for one shift results in a fixed monthly cost of Rs. 800. Fixed monthly costs for second shift operation are estimated at Rs. 1200. Each shift operation provides capacity for producing 30 widgets per month.
Note : Average unit cost, AC = Total monthly costs/monthly production, and
Marginal cost, MC is the rate of change in total cost for unit change in quantity produced.

Total production in July is 40 units. What is the approximate average unit cost for July?
Answer the following question based on the information given below.
ABC Ltd. produces widgets for which the demand is unlimited and they can sell all of their production. The graph below describes the monthly variable costs incurred by the company as a function of the quantity produced. In addition, operating the plant for one shift results in a fixed monthly cost of Rs. 800. Fixed monthly costs for second shift operation are estimated at Rs. 1200. Each shift operation provides capacity for producing 30 widgets per month.
Note : Average unit cost, AC = Total monthly costs/monthly production, and
Marginal cost, MC is the rate of change in total cost for unit change in quantity produced.
ABC Ltd. is considering increasing the production level. What is the approximate marginal cost of increasing production from its July level of 40 units?
Answer the following question based on the information given below.
ABC Ltd. produces widgets for which the demand is unlimited and they can sell all of their production. The graph below describes the monthly variable costs incurred by the company as a function of the quantity produced. In addition, operating the plant for one shift results in a fixed monthly cost of Rs. 800. Fixed monthly costs for second shift operation are estimated at Rs. 1200. Each shift operation provides capacity for producing 30 widgets per month.
Note : Average unit cost, AC = Total monthly costs/monthly production, and
Marginal cost, MC is the rate of change in total cost for unit change in quantity produced.
From the data provided it can be inferred that, for production levels in the range of 0 to 60 units.
Answer the following question based on the information given below.
ABC Ltd. produces widgets for which the demand is unlimited and they can sell all of their production. The graph below describes the monthly variable costs incurred by the company as a function of the quantity produced. In addition, operating the plant for one shift results in a fixed monthly cost of Rs. 800. Fixed monthly costs for second shift operation are estimated at Rs. 1200. Each shift operation provides capacity for producing 30 widgets per month.
Note : Average unit cost, AC = Total monthly costs/monthly production, and
Marginal cost, MC is the rate of change in total cost for unit change in quantity produced.
Suppose that each widget sells for Rs 150. What is the profit earned by ABC Ltd. in July? (Profit is defined as the excess of sales revenue over total cost.)
Answer the following question based on the information given below.
ABC Ltd. produces widgets for which the demand is unlimited and they can sell all of their production. The graph below describes the monthly variable costs incurred by the company as a function of the quantity produced. In addition, operating the plant for one shift results in a fixed monthly cost of Rs. 800. Fixed monthly costs for second shift operation are estimated at Rs. 1200. Each shift operation provides capacity for producing 30 widgets per month.
Note : Average unit cost, AC = Total monthly costs/monthly production, and
Marginal cost, MC is the rate of change in total cost for unit change in quantity produced.
Assume that the unit price is Rs. 150 and profit is defined as the excess of sales revenue over total costs. What is the monthly production level of ABC Ltd. at which the profit is highest?
Answer the following question based on the information given below.
ABC Ltd. produces widgets for which the demand is unlimited and they can sell all of their production. The graph below describes the monthly variable costs incurred by the company as a function of the quantity produced. In addition, operating the plant for one shift results in a fixed monthly cost of Rs. 800. Fixed monthly costs for second shift operation are estimated at Rs. 1200. Each shift operation provides capacity for producing 30 widgets per month.
Note : Average unit cost, AC = Total monthly costs/monthly production, and
Marginal cost, MC is the rate of change in total cost for unit change in quantity produced.
For monthly production level in the range of 0 to 30 units
Directions: Answer the questions based on the following information.
The figure below represents sales and net profit in Rs. crore of IVP Ltd. for five years from 1994-95 to 1998-99. During this period the sales increased from Rs. 100 crore to Rs. 680 crore. Correspondingly, the net profit increased from Rs. 2.5 crore to Rs. 12 crore. Net profit is defined as the excess of sales over total costs.
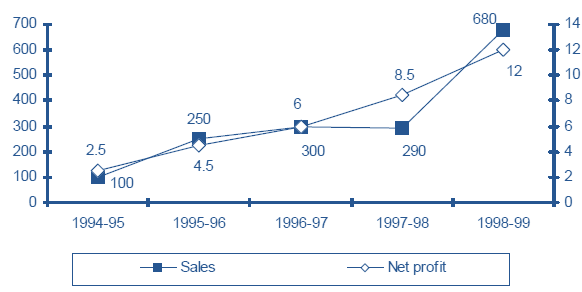
The highest percentage of growth in sales, relative to the previous year, occurred in
Directions: Answer the questions based on the following information.
The figure below represents sales and net profit in Rs. crore of IVP Ltd. for five years from 1994-95 to 1998-99. During this period the sales increased from Rs. 100 crore to Rs. 680 crore. Correspondingly, the net profit increased from Rs. 2.5 crore to Rs. 12 crore. Net profit is defined as the excess of sales over total costs.
The highest percentage growth in net profit, relative to the previous year, was achieved in
Directions: Answer the questions based on the following information.
The figure below represents sales and net profit in Rs. crore of IVP Ltd. for five years from 1994-95 to 1998-99. During this period the sales increased from Rs. 100 crore to Rs. 680 crore. Correspondingly, the net profit increased from Rs. 2.5 crore to Rs. 12 crore. Net profit is defined as the excess of sales over total costs.
Defining profitability as the ratio of net profit to sales, IVP Ltd., recorded the highest profitability in
Directions: Answer the questions based on the following information.
The figure below represents sales and net profit in Rs. crore of IVP Ltd. for five years from 1994-95 to 1998-99. During this period the sales increased from Rs. 100 crore to Rs. 680 crore. Correspondingly, the net profit increased from Rs. 2.5 crore to Rs. 12 crore. Net profit is defined as the excess of sales over total costs.
With profitability as defined in question 137, it can be concluded that
Directions: Answer the questions based on the following information.
These questions are based on the price fluctuations of four commodities — arhar, pepper, sugar and gold during February-July 1999 as described in the figures below.
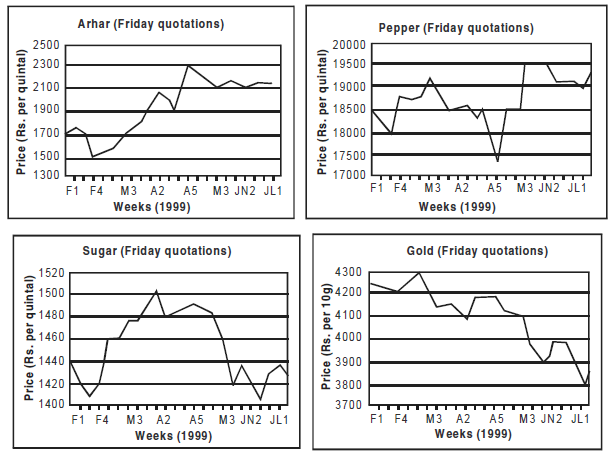
Price change of a commodity is defined as the absolute difference in ending and beginning prices expressed as a percentage of the beginning. What is the commodity with the highest price change?
Directions: Answer the questions based on the following information.
These questions are based on the price fluctuations of four commodities — arhar, pepper, sugar and gold during February-July 1999 as described in the figures below.
Price volatility (PV) of a commodity is defined as follows:
PV = (Highest price during the period – Lowest price during the period)/Average price during the period. What is the commodity with the lowest price volatility?
Directions: Answer the questions based on the following information.
These questions are based on the price fluctuations of four commodities — arhar, pepper, sugar and gold during February-July 1999 as described in the figures below.
Mr X, a fund manager with an investment company invested 25% of his funds in each of the four commodities at the beginning of the period. He sold the commodities at the end of the period. His investments in the commodities resulted in
Directions: Answer the questions based on the following information.
These questions are based on the price fluctuations of four commodities — arhar, pepper, sugar and gold during February-July 1999 as described in the figures below.
The price volatility(PV) of the commodity with the highest PV during the February-July period is approximately equal to
Direction: Answer the questions based on the following information.
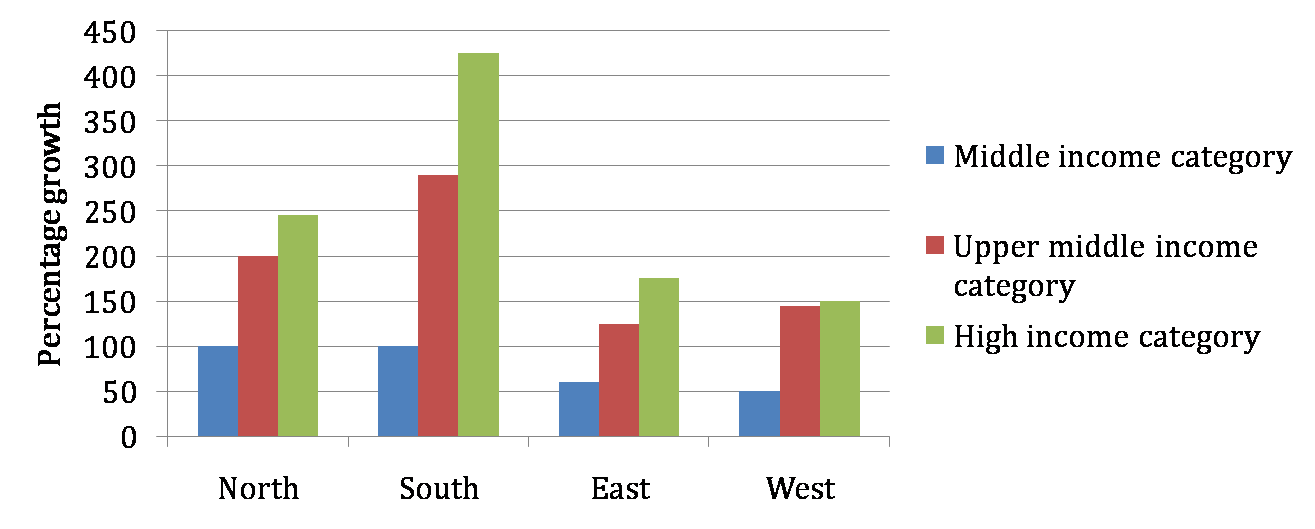
The following bar chart gives the growth percentage in the number of households in middle, upper-middle and high income categories in the four regions for the period between 1987-88 and 1994-95.
 âââââââ
Which region showed the highest growth in number of households in all the income categories for the period?
Direction: Answer the questions based on the following information.
The following bar chart gives the growth percentage in the number of households in middle, upper-middle and high income categories in the four regions for the period between 1987-88 and 1994-95.
âââââââ
What was the total household income in northern region for upper-middle class?
Direction: Answer the questions based on the following information.
The following bar chart gives the growth percentage in the number of households in middle, upper-middle and high income categories in the four regions for the period between 1987-88 and 1994-95.
âââââââ
What is the percentage increase in total number of households for the northern region (upper-middle) over the given period?
Direction: Answer the questions based on the following information.
The following bar chart gives the growth percentage in the number of households in middle, upper-middle and high income categories in the four regions for the period between 1987-88 and 1994-95.
âââââââ
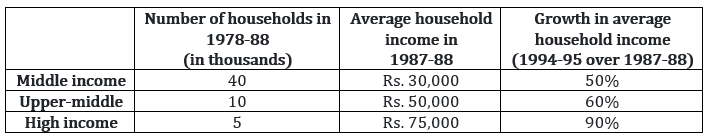
What was the average income of the high-income group in 1987-88?
Direction: Answer the questions based on the following information.
The following bar chart gives the growth percentage in the number of households in middle, upper-middle and high income categories in the four regions for the period between 1987-88 and 1994-95.
âââââââ
Additional direction: The numbers of households in each category were equally distributed in all the regions.
The ratio of total income for the high-income category to the upper-middle class increased by how much percentage in the given period?
Direction: Answer the questions based on the following information.
The following bar chart gives the growth percentage in the number of households in middle, upper-middle and high income categories in the four regions for the period between 1987-88 and 1994-95.
âââââââ
Additional direction: The numbers of households in each category were equally distributed in all the regions.
The average income for the northern region in 1987-88 was
Direction: Answer the questions based on the following information.
Ghosh Babu has a manufacturing unit. The following graph gives the cost for various number of units. Given: Profit = Revenue – Variable cost – Fixed cost. The fixed cost remains constant up to 34 units after which additional investment is to be done in fixed assets. In any case, production cannot exceed 50 units.
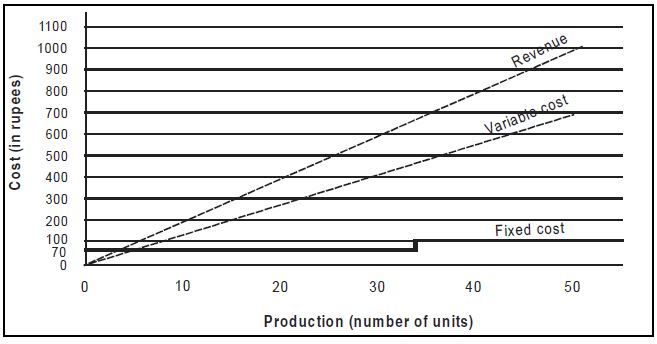
What is the minimum number of units that need to be produced to make sure that there was no loss?
Direction: Answer the questions based on the following information.
Ghosh Babu has a manufacturing unit. The following graph gives the cost for various number of units. Given: Profit = Revenue – Variable cost – Fixed cost. The fixed cost remains constant up to 34 units after which additional investment is to be done in fixed assets. In any case, production cannot exceed 50 units.
How many units should be manufactured such that the profit was at least Rs. 50?
Direction: Answer the questions based on the following information.
Ghosh Babu has a manufacturing unit. The following graph gives the cost for various number of units. Given: Profit = Revenue – Variable cost – Fixed cost. The fixed cost remains constant up to 34 units after which additional investment is to be done in fixed assets. In any case, production cannot exceed 50 units.
If at the most 40 units can be manufactured, then what is the number of units that can be manufactured to maximise profit per unit?
Direction: Answer the questions based on the following information.
Ghosh Babu has a manufacturing unit. The following graph gives the cost for various number of units. Given: Profit = Revenue – Variable cost – Fixed cost. The fixed cost remains constant up to 34 units after which additional investment is to be done in fixed assets. In any case, production cannot exceed 50 units.
If the production cannot exceed 45 units, then what is the number of units that can maximise profit per unit?
Direction: Answer the questions based on the following information.
Ghosh Babu has a manufacturing unit. The following graph gives the cost for various number of units. Given: Profit = Revenue – Variable cost – Fixed cost. The fixed cost remains constant up to 34 units after which additional investment is to be done in fixed assets. In any case, production cannot exceed 50 units.
If the fixed cost of production goes up by Rs. 40, then what is the minimum number of units that need to be manufactured to make sure that there is no loss?
Direction: Answer the questions based on the following information.
In the following chart, the price of logs shown is per cubic metre that of plywood and saw timber is per tonne.
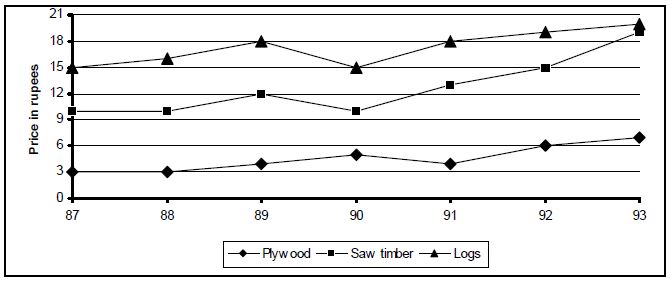
What is the maximum percentage increase in price per cubic metre or per tonne over the previous year?
Direction: Answer the questions based on the following information.
In the following chart, the price of logs shown is per cubic metre that of plywood and saw timber is per tonne.
Which product shows the maximum percentage increase in price over the period?
Direction: Answer the questions based on the following information.
In the following chart, the price of logs shown is per cubic metre that of plywood and saw timber is per tonne.
If 1 m3 = 750 kg for saw timber, find in which year was the difference in prices of saw timber and logs the least?
Direction: Answer the questions based on the following information.
In the following chart, the price of logs shown is per cubic metre that of plywood and saw timber is per tonne.
If one cubic metre = 700 kg for plywood and 800 kg for saw timber, find in which year was the difference in the prices of plywood and saw timber (per cubic metre) the maximum?
Direction: Answer the questions based on the following information.
In the following chart, the price of logs shown is per cubic metre that of plywood and saw timber is per tonne.
If the volume sales of plywood, saw timber and logs were 40%, 30% and 30% respectively, then what was the average realisation in 1993 per cubic metre of sales? (Weight of one cubic metre of saw dust and plywood both = 800 kg)
Direction: Answer the questions based on the following information.
In the following chart, the price of logs shown is per cubic metre that of plywood and saw timber is per tonne.
In the previous question, if in 1994, prices increased by 5%, 1% and 10% while the volume sales break-up was 40%, 30% and 30% for plywood, saw timber and logs respectively, then what was the average realisation?
Direction: Answer the questions based on the following graph.
The graph given below shows the quantity of milk and food grains consumed annually along with female and male population (in millions). Use the data to answer the questions that follow.
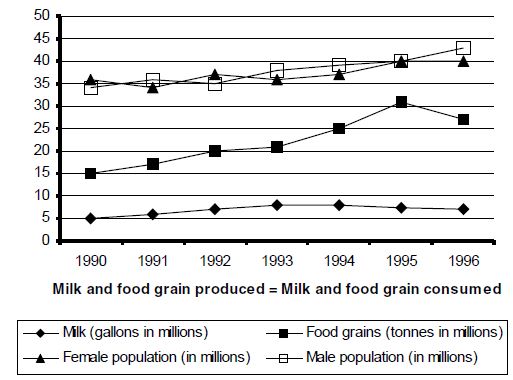
When was the per capita production of milk least?
Direction: Answer the questions based on the following graph.
The graph given below shows the quantity of milk and food grains consumed annually along with female and male population (in millions). Use the data to answer the questions that follow.
When was the per capita production of foodgrains most?
Direction: Answer the questions based on the following graph.
The graph given below shows the quantity of milk and food grains consumed annually along with female and male population (in millions). Use the data to answer the questions that follow.
In which year was the difference between the percentage increase in the production of foodgrains and milk maximum?
Direction: Answer the questions based on the following graph.
The graph given below shows the quantity of milk and food grains consumed annually along with female and male population (in millions). Use the data to answer the questions that follow.
If milk contains 320 calories and foodgrains contain 160 calories, in which year was the per capita consumption of calories highest?
Direction: Answer the questions based on the following graph.
The graph given below shows the quantity of milk and food grains consumed annually along with female and male population (in millions). Use the data to answer the questions that follow.
If one gallon milk contains 120 g of a particular nutrient and one tonne of foodgrains contains 80 g of the same nutrient, in which year was the availability of this nutrient maximum?
Direction: Answer the questions based on the following graph.
The graph given below shows the quantity of milk and food grains consumed annually along with female and male population (in millions). Use the data to answer the questions that follow.
Referring to the above question, in which year was the per capita consumption of this nutrient highest?
Direction: Answer the questions based on the following graph.
The graph given below gives the yearly details of money invested in producing a certain product over the years 1991 to 1995. It also gives the profit (in ‘000 rupees).
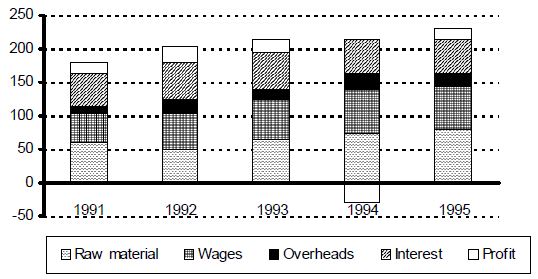
In which year was the increase in raw material maximum?
Direction: Answer the questions based on the following graph.
The graph given below gives the yearly details of money invested in producing a certain product over the years 1991 to 1995. It also gives the profit (in ‘000 rupees).
In which period was the change in profit maximum?
Direction: Answer the questions based on the following graph.
The graph given below gives the yearly details of money invested in producing a certain product over the years 1991 to 1995. It also gives the profit (in ‘000 rupees).
Which component of the cost production has remained more or less constant over the period?
Direction: Answer the questions based on the following graph.
The graph given below gives the yearly details of money invested in producing a certain product over the years 1991 to 1995. It also gives the profit (in ‘000 rupees).
In which year were the overheads, as a percentage of the raw material, maximum?
Direction: Answer the questions based on the following graph.
The graph given below gives the yearly details of money invested in producing a certain product over the years 1991 to 1995. It also gives the profit (in ‘000 rupees).
What percentage of the costs did the profits form over the period?
Direction: Answer the questions based on the following graph.
The graph given below gives the yearly details of money invested in producing a certain product over the years 1991 to 1995. It also gives the profit (in ‘000 rupees).
If the interest component is not included in the total cost calculation, which year would show the maximum profit per unit cost?
Direction: Answer the questions based on the following graph.

Employees in thousands Sales – Cost = Profit
Which month records the highest profit?
Direction: Answer the questions based on the following graph.
Employees in thousands Sales – Cost = Profit
In which month is the total increase in the cost highest as compared to two months ago?
Direction: Answer the questions based on the following graph.
Employees in thousands Sales – Cost = Profit
In which month is the percentage increase in sales two months before, the highest?
Direction: Answer the questions based on the following graph.
Employees in thousands Sales – Cost = Profit
Which month has the highest profit per employee?
Direction: Answer the questions based on the following graph.
Employees in thousands Sales – Cost = Profit
Assuming that no employees left the job, how many more people did the company take on in the given period?
Direction: Answer the questions based on the following graph.

In which year was the trade deficit highest?
Direction: Answer the questions based on the following graph.
In how many years was the trade deficit less than the trade deficit in the succeeding year?
Direction: Answer the questions based on the following graph.
Export earning in 1990-91 is how many per cent of imports in 1991-92?
Direction: Answer the questions based on the following graph.
In the last three years, the total export earnings have accounted for how many per cent of the value of the imports?
Direction: Answer the questions based on the following graph.
Which of the following statements can be inferred from the graph?
I. In all the years shown in the graph, the trade deficit is less than the export earning.
II. Export earnings increased in every year between 1989-90 and 1991-92.
III. In all the years shown in the graph, the earning by exports is less than the expenditure on imports in the preceding year.
Direction: Answer the questions based on the following graph.
Revenue obtained by a publishing house while selling books, magazines and journals (Rs.in lakh).

Which year shows the highest change in revenue obtained from journals?
Direction: Answer the questions based on the following graph.
Revenue obtained by a publishing house while selling books, magazines and journals (Rs.in lakh).
In 1992, what per cent of the total revenue came from books?
Direction: Answer the questions based on the following graph.
Revenue obtained by a publishing house while selling books, magazines and journals (Rs.in lakh).
The number of years in which there was an increase in revenue from at least two categories is
Direction: Answer the questions based on the following graph.
Revenue obtained by a publishing house while selling books, magazines and journals (Rs.in lakh).
If 1993 were to show the same growth as 1992 over 1991, the revenue in 1993 must be
Direction: Answer the questions based on the following graph.
Revenue obtained by a publishing house while selling books, magazines and journals (Rs.in lakh).
The growth in total revenue from 1989 to 1992 is
Study the graph below and answer the questions that follow.
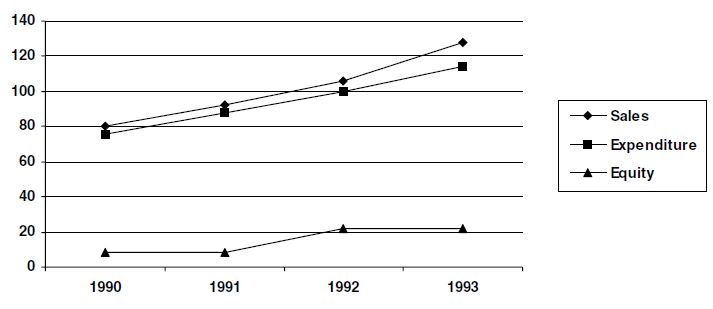
Profit is defined as Sales - Expenditure
In which year is the profit per rupee of equity the highest?
Study the graph below and answer the questions that follow.
Profit is defined as Sales - Expenditure
The simple annual growth rate in sales was the highest between the years?
Study the graph below and answer the questions that follow.
Profit is defined as Sales - Expenditure
In which year is the sales per rupee of expenditure the lowest?
Study the graph below and answer the questions that follow.
Profit is defined as Sales - Expenditure
In which year is sales per rupee of equity the highest?
Study the graph below and answer the questions.
Total Assets are defined as Net Fixed Assets + Net Current Assets + Investments
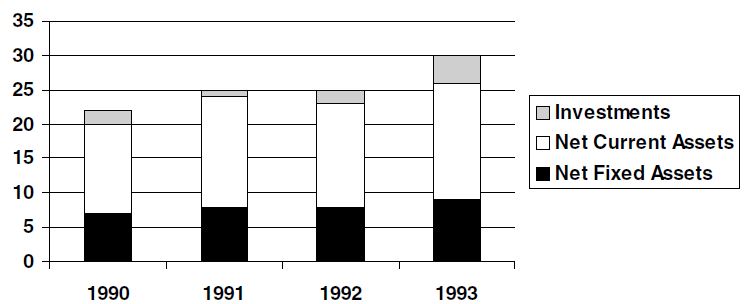
What is the approximate simple annual growth rate of Total Assets 1990 and 1993?
Study the graph below and answer the questions.
Total Assets are defined as Net Fixed Assets + Net Current Assets + Investments
In any two consecutive years, the growth rate is lowest for
Study the graph below and answer the questions.
Total Assets are defined as Net Fixed Assets + Net Current Assets + Investments
Between 1991 and 1992, the highest growth rate was seen for
Study the graph below and answer the questions.
Total Assets are defined as Net Fixed Assets + Net Current Assets + Investments
The only item which has not shown a negative growth in every year between 1990 and 1993 is
The graph below shows the end of the month market values of 4 shares for the period from January to June. Answer the following questions based on this graph.
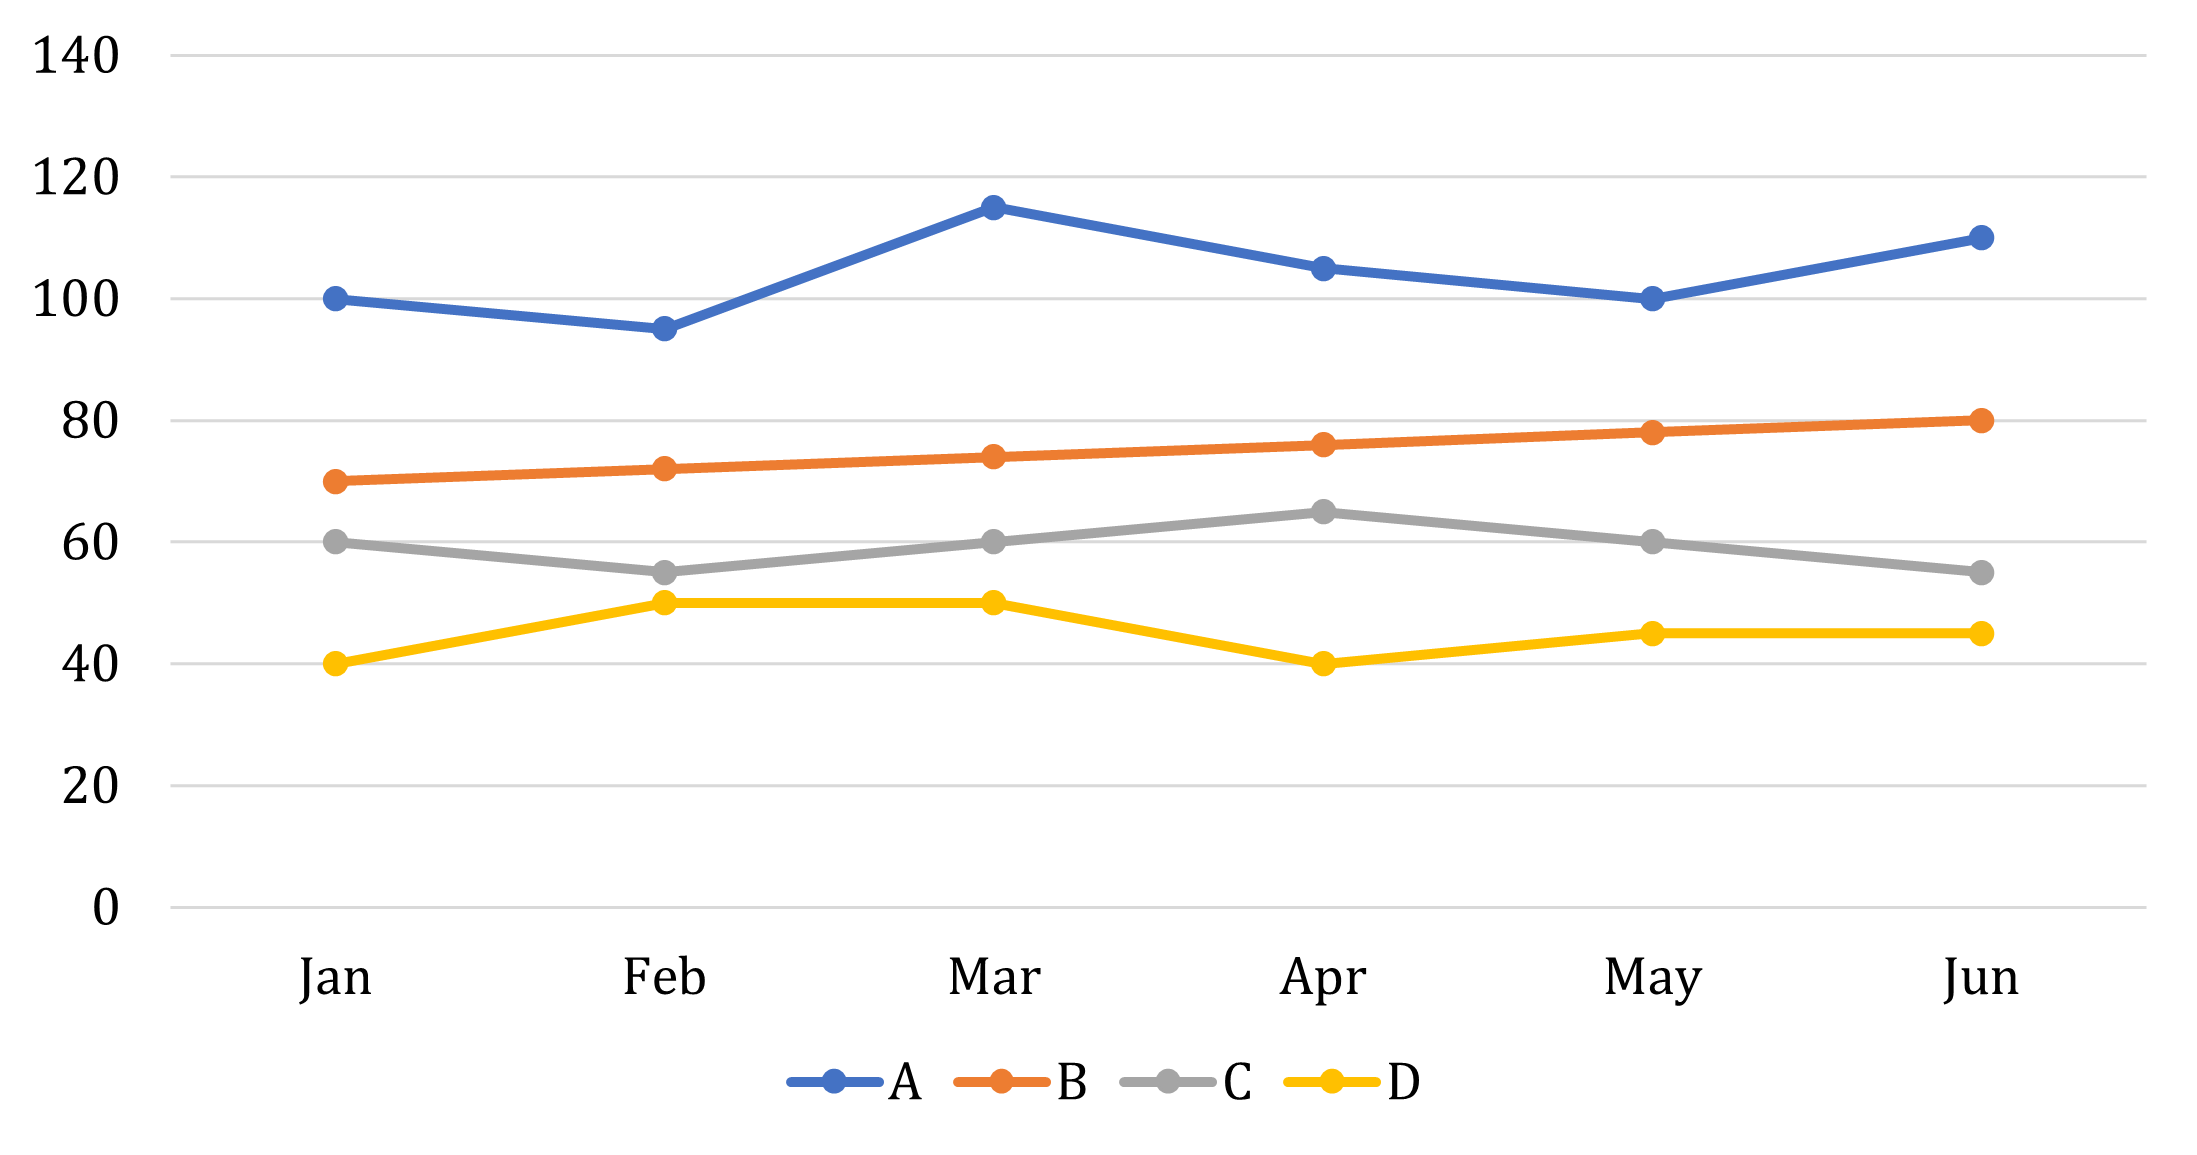
Which share showed the greatest percentage increase in market value in any month during the entire period?
The graph below shows the end of the month market values of 4 shares for the period from January to June. Answer the following questions based on this graph.
In which month was the greatest absolute change in market value for any share recorded?
The graph below shows the end of the month market values of 4 shares for the period from January to June. Answer the following questions based on this graph.
In which month was the greatest percentage increase in market value for any share recorded?
The graph below shows the end of the month market values of 4 shares for the period from January to June. Answer the following questions based on this graph.
An individual wishes to sell 1 share of C and 1 share of D to buy 1 share of A at the end of a month. At which month-end would the individual’s loss from this decision, due to share value changes, be the most?
The graph below shows the end of the month market values of 4 shares for the period from January to June. Answer the following questions based on this graph.
An individual decides to sell 1 share of C and 1 share of D to buy 1 share of A at the end of the month. What can be the individual’s greatest gain from this decision, due to share value changes?
Study the following graph and answer questions that follow. The x – axis denotes the years from 1983 to 1991.
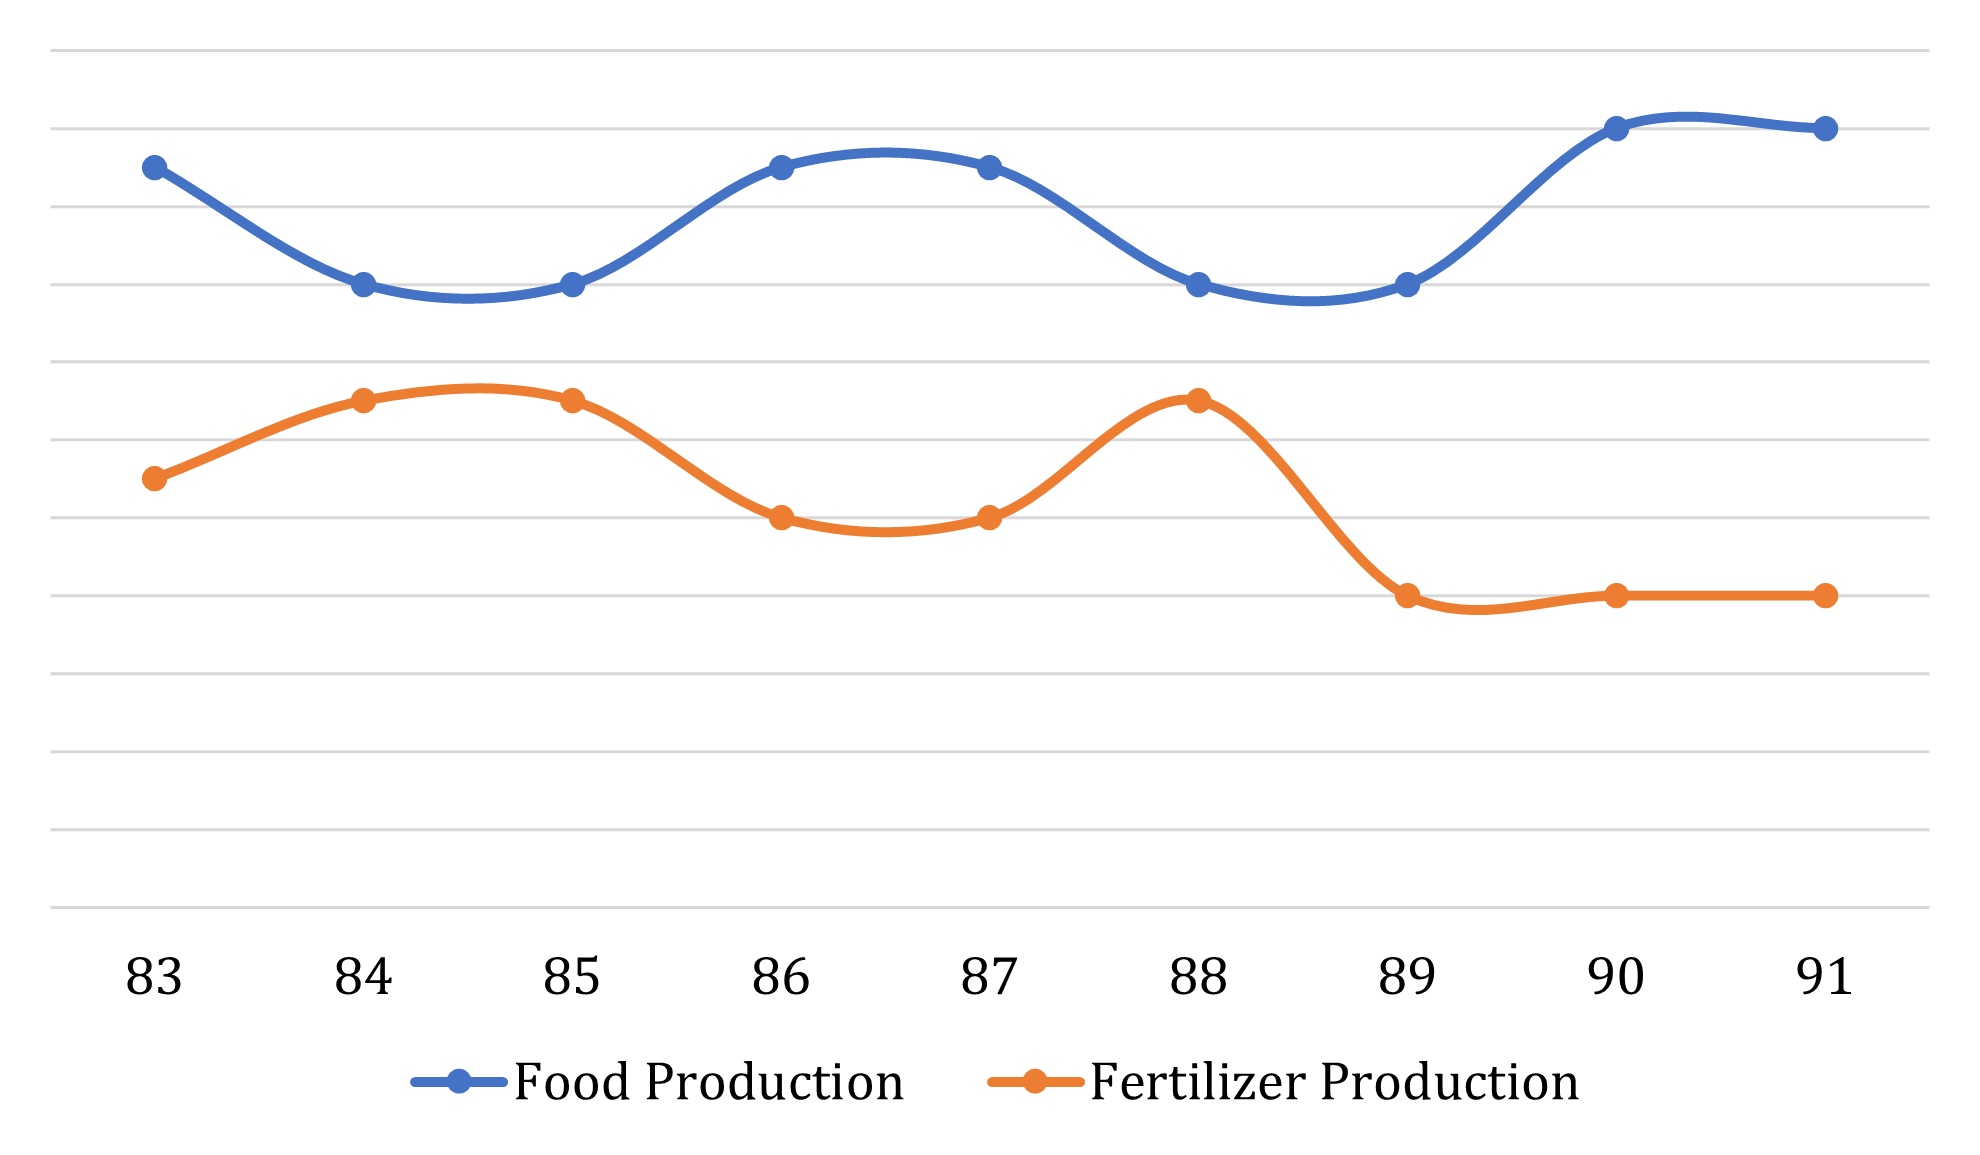
The sum of food and fertilizer production has shown a constant value for how many years?
Study the following graph and answer questions that follow. The x – axis denotes the years from 1983 to 1991.
If in 1988, the sum of the food and fertilizer production was 170 million tonnes, the value of food production must have been (approximately, in million tonnes) …
Study the following graph and answer questions that follow. The x – axis denotes the years from 1983 to 1991.
From its apparent behaviour, the food production in year 1992 can be expected to …
Study the following graph and answer questions that follow. The x – axis denotes the years from 1983 to 1991.
Going according to previous trends, one can say that the Fertilizer Production has shown an anomalous behaviour in which year?
Study the following graph and answer questions that follow. The x – axis denotes the years from 1983 to 1991.
A scholar observed that if the production of fertilizers in 1989 had been the same as that in 1988, then the total fertilizer production for all the given years would have been 450 million tonnes. Using this information, and knowing that the food production has been plotted on the same scale, one may say that the food production in 1983 was approximately, in million tonnes) …