Bubble Charts — XAT Previous-Year Questions
5 previous-year questions on Bubble Charts from XAT, with full solutions. Practise free — check answers as you go; sign in to save your progress.
Bubble Charts · XAT PYQs
Read the following scenario and answer the three questions that follow.
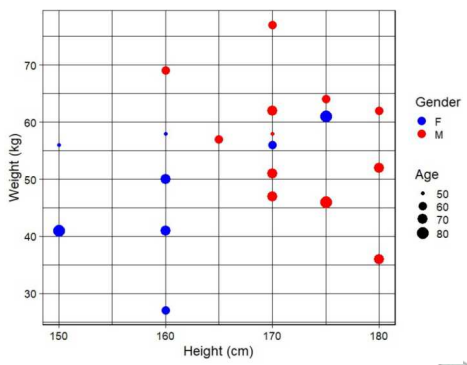
The following plot describes the height (in cm), weight (in kg), age (in years) and gender (F for female, M for male) of 20 patients visiting a hospital.
 âââââââ
A person’s body mass index (BMI) is calculated as weight (in kg) divided by squared height (measured in square metres). For example, a person weighing 100 kg and of height 100 cm (1m) will have a BMI of 100. A person with BMI less than or equal to 18.5 is considered as underweight, above 18.5 but less than or equal to 25 as normal weight, above 25 but less than or equal to 30 as overweight, and above 30 as obese.
The average age of the female patients who weigh 50 kg or above is approximately
Answer the next 4 questions based on the following information:
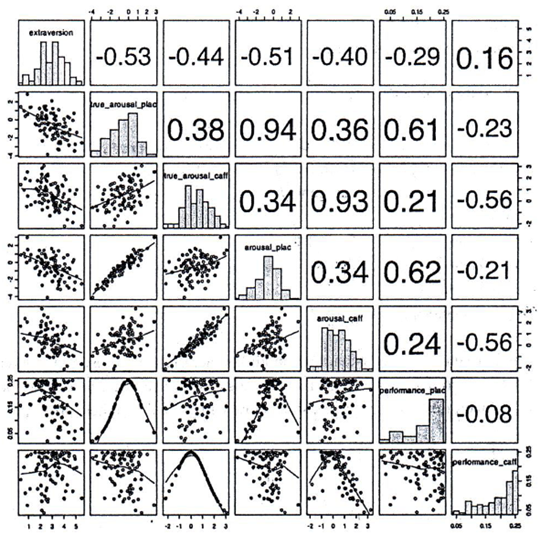
The grid below captures relationships among seven personality dimensions: "extraversion", "true_arousal_plac", "true_arousal_caff”, "arousal_plac", "arousal_caff”, "performance_plac", and "performance caff”. The diagonal represents histograms of the seven dimensions. Left of the diagonal represents scatterplots between the dimensions while the right of the diagonal represents quantitative relationships between the dimensions. The lines in the scatterplots are closest approximation of the points. The value of the relationships to the right of the diagonal can vary from -1 to +1, with -1 being the extreme linear negative relation and +1 extreme linear positive relation. (Axes of the graph are conventionally drawn).
 âââââââ
Which of the following is true?
Answer the next 4 questions based on the following information:
The grid below captures relationships among seven personality dimensions: "extraversion", "true_arousal_plac", "true_arousal_caff”, "arousal_plac", "arousal_caff”, "performance_plac", and "performance caff”. The diagonal represents histograms of the seven dimensions. Left of the diagonal represents scatterplots between the dimensions while the right of the diagonal represents quantitative relationships between the dimensions. The lines in the scatterplots are closest approximation of the points. The value of the relationships to the right of the diagonal can vary from -1 to +1, with -1 being the extreme linear negative relation and +1 extreme linear positive relation. (Axes of the graph are conventionally drawn).
âââââââ
Which of the scatterplots shows the weakest relationship?
Answer the next 4 questions based on the following information:
The grid below captures relationships among seven personality dimensions: "extraversion", "true_arousal_plac", "true_arousal_caff”, "arousal_plac", "arousal_caff”, "performance_plac", and "performance caff”. The diagonal represents histograms of the seven dimensions. Left of the diagonal represents scatterplots between the dimensions while the right of the diagonal represents quantitative relationships between the dimensions. The lines in the scatterplots are closest approximation of the points. The value of the relationships to the right of the diagonal can vary from -1 to +1, with -1 being the extreme linear negative relation and +1 extreme linear positive relation. (Axes of the graph are conventionally drawn).
âââââââ
In which of the following scatterplots, the value of one dimension can be used to predict the value of another, as accurately as possible?
Answer the next 4 questions based on the following information:
The grid below captures relationships among seven personality dimensions: "extraversion", "true_arousal_plac", "true_arousal_caff”, "arousal_plac", "arousal_caff”, "performance_plac", and "performance caff”. The diagonal represents histograms of the seven dimensions. Left of the diagonal represents scatterplots between the dimensions while the right of the diagonal represents quantitative relationships between the dimensions. The lines in the scatterplots are closest approximation of the points. The value of the relationships to the right of the diagonal can vary from -1 to +1, with -1 being the extreme linear negative relation and +1 extreme linear positive relation. (Axes of the graph are conventionally drawn).
âââââââ
Which of the following options is correct?