XAT 2018 — QA & DI Question 26
Answer the next 3 questions based on the information given below.
 âââââââ
 âââââââ
 âââââââ
 âââââââ
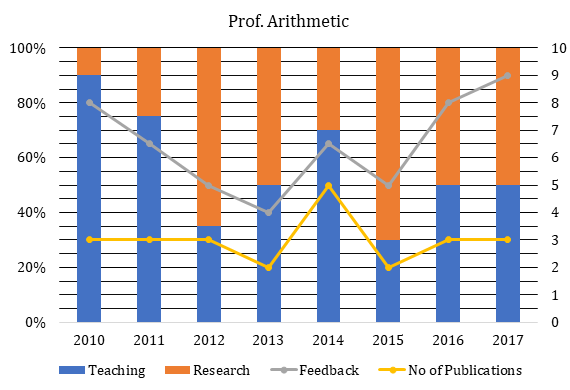
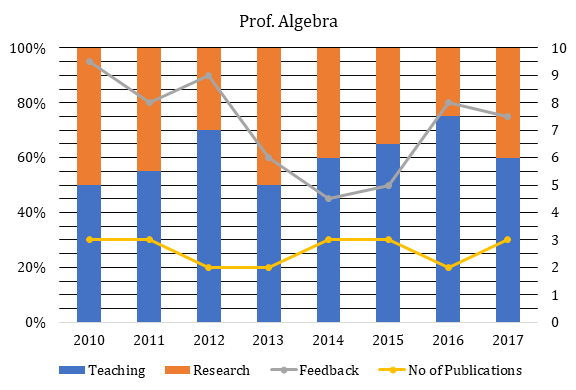
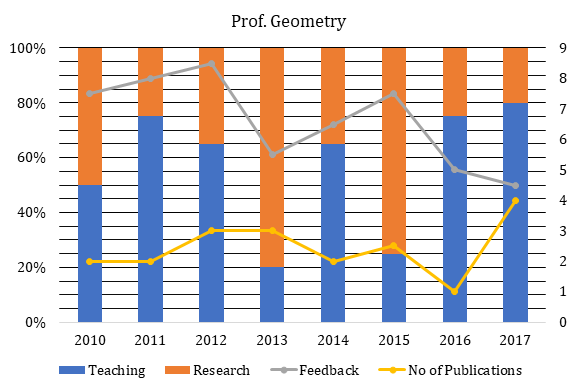
The graphs below represent the performance of four professors, across years, measured on four variables: Percentage of time spent on teaching, percentage of time spent on research, feedback (on a scale of 10, right-hand side) and number of publications (right-hand side). Assume that the cumulative time spent per year on research and teaching activities are same for all four professors and each of them taught only one course of 90 classroom hours.
Count the number of instances in which "annual decreasing efforts in research" is accompanied with "annual increase in feedback"?
Answer & solution
- A
5
- B
7
9
- D
11
- E
None of the above
Prof. Arithmetic: 2 instances in years 2014 and 2016.
Prof. Algebra: 3 instances in years 2012, 2015 and 2016.
Prof. Geometry: 2 instances in years 2011 and 2014.
Prof. Calculus: 2 instances in years 2011 and 2015.
Therefore, there are 9 instances.
Hence, option (c).