XAT 2022 — QA & DI Question 21
Read the following scenario and answer the THREE questions that follow.
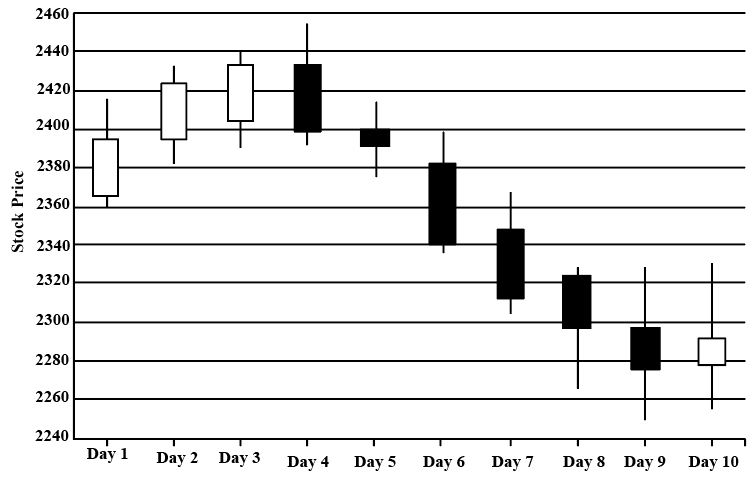
The given candlestick chart depicts the prices of a particular stock over 10 consecutive days. A candlestick comprises of a rectangular box pieced by a line. The top and bottom ends of the line respectively indicate the maximum and minimum prices of the stock on that day, while the horizontal edges of the rectangle correspond to the stock's opening and closing prices. If the rectangle is white, the opening price is lower than the closing price, but if the rectangle is black, then it is the other way around.
Using the above information, answer the questions that follow:
On which day is the ratio of the maximum price to the opening price, the highest across the ten days?
Answer & solution
Correct answer: Day 10
- A
Day 3
- B
Day 4
Day 10
- D
Day 1
- E
Day 9
Going by considering the given options :
The ratio is given by:
Day 3 : (Maximum price, Opening price) : (2440, 2405) = the ratio = 1.014
Day 4 : (Maximum price, Opening price) : (2455, 2432.5) = ratio = 1.009
Day 10 : (Maximum price, Opening price) : (2330, 2292.5) = 1.016
Day 1 : (Maximum price, Opening price) : (2415, 2395) = 1.008
Day 9 : (Maximum price, Opening price) : (2330, 2297.5) = 1.014
Day 10 has the maximum ratio.
Related Bar Graphs questions
- Which of the five universities can Univ 4 possibly be?…
- Which Univ’s enrolment was around twice that of LTU in 2014?…
- Which amongst the pieces of information mentioned below, if removed, will not pr…
- Which day saw the maximum percentage increase in the stock price at closing from…
- What is the highest magnitude of change over two consecutive days (for example,D…