CAT 1993 — DILR Question 19
Bar GraphsEasy
Passage / Data
Study the graph below and answer the questions.
Total Assets are defined as Net Fixed Assets + Net Current Assets + Investments
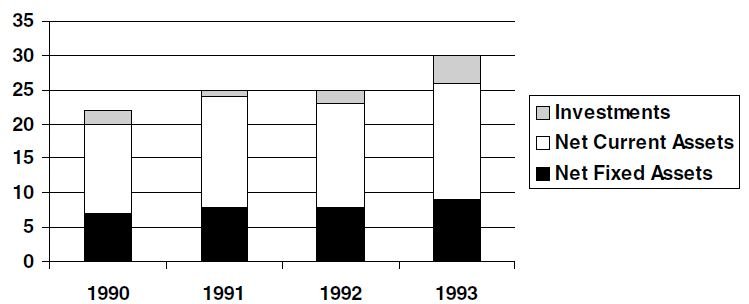
Between 1991 and 1992, the highest growth rate was seen for
Answer & solution
Correct answer: Investments.
- A
Net Fixed Assets
- B
Net Current Assets.
Investments.
- D
Total Assets.
Solution
The given graph can be represented in the following manner:
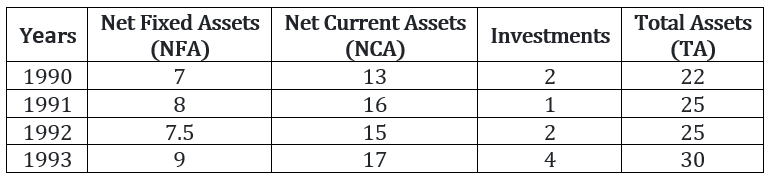
Between 1991 and 1992, the highest growth rate was seen for investments viz. 100% increase.
Related Bar Graphs questions
- In which year is the profit per rupee of equity the highest?…
- The simple annual growth rate in sales was the highest between the years?…
- In which year is the sales per rupee of expenditure the lowest?…
- In which year is sales per rupee of equity the highest?…
- What is the approximate simple annual growth rate of Total Assets 1990 and 1993?…
- In any two consecutive years, the growth rate is lowest for…