CAT 1993 — DILR
All 33 DILR questions from CAT 1993, with the answer key and detailed solutions. Practise free — check answers as you go, or tap Show solution.
CAT 1993 · DILR
Read the text and the numbered statements carefully and answer the questions given at the end.
Four people of different nationalities live on the same side of a street in four houses each of different color. Each person has a different favorite drink. The following additional information is also known:
- The Englishman lives in the red house.
- The Italian drinks tea.
- The Norwegian lives in the first house on the left.
- In the second house from the right they drink milk.
- The Norwegian lives adjacent to the blue house.
- The Spaniard drinks fruit juice.
- Tea is drunk in the blue house.
- The white house is to the right of the red house.
The color of the Norwegian’s house is
Read the text and the numbered statements carefully and answer the questions given at the end.
Four people of different nationalities live on the same side of a street in four houses each of different color. Each person has a different favorite drink. The following additional information is also known:
- The Englishman lives in the red house.
- The Italian drinks tea.
- The Norwegian lives in the first house on the left.
- In the second house from the right they drink milk.
- The Norwegian lives adjacent to the blue house.
- The Spaniard drinks fruit juice.
- Tea is drunk in the blue house.
- The white house is to the right of the red house.
Milk is drunk by
Read the text and the numbered statements carefully and answer the questions given at the end.
Four people of different nationalities live on the same side of a street in four houses each of different color. Each person has a different favorite drink. The following additional information is also known:
- The Englishman lives in the red house.
- The Italian drinks tea.
- The Norwegian lives in the first house on the left.
- In the second house from the right they drink milk.
- The Norwegian lives adjacent to the blue house.
- The Spaniard drinks fruit juice.
- Tea is drunk in the blue house.
- The white house is to the right of the red house.
The Norwegian drinks
Read the text and the numbered statements carefully and answer the questions given at the end.
Four people of different nationalities live on the same side of a street in four houses each of different color. Each person has a different favorite drink. The following additional information is also known:
- The Englishman lives in the red house.
- The Italian drinks tea.
- The Norwegian lives in the first house on the left.
- In the second house from the right they drink milk.
- The Norwegian lives adjacent to the blue house.
- The Spaniard drinks fruit juice.
- Tea is drunk in the blue house.
- The white house is to the right of the red house.
Which of the following is not true?
Refer to the following information and answer the questions that follow.
“Kya – Kya” is an island in the South Pacific. The inhabitants of “Kya – Kya” always answer any question with two sentences, one of which is always true and the other always false.
You find that your boat is stolen. You question three inhabitants of the island and they reply as follows:
John says, “I didn’t do it. Mathew didn’t do it.”
Mathew says. “I didn’t do it. Krishna didn’t do it.”
Krishna says. “I didn’t do it. I don’t know who did it.”
Who stole your boat?
Refer to the following information and answer the questions that follow.
“Kya – Kya” is an island in the South Pacific. The inhabitants of “Kya – Kya” always answer any question with two sentences, one of which is always true and the other always false.
There is only one pilot on the island. You interview three men, Koik, Lony and Mirna. You also notice that Koik is wearing a cap.
Mirna says, “Lony’s father is the pilot. Lony is not the priest’s son.”
Koik says, “I am the priest. On this island, only priests can wear caps.”
Lony says, “I am the priest’s son. Koik is not the priest.”
Which of the following is true?
Refer to the following information and answer the questions that follow.
“Kya – Kya” is an island in the South Pacific. The inhabitants of “Kya – Kya” always answer any question with two sentences, one of which is always true and the other always false.
You are walking on the road and come to a fork. You ask the inhabitants Ram, Laxman and Lila. ”Which road will take me to the village?”
Ram says, “I never speak to strangers. I am new to these parts.”
Laxman says, “I am married to Lila. Take the left road.”
Lila says, “I am married to Ram. He is not new to this place.”
Which of the following is true?
Refer to the following information and answer the questions that follow.
“Kya – Kya” is an island in the South Pacific. The inhabitants of “Kya – Kya” always answer any question with two sentences, one of which is always true and the other always false.
You want to speak to the chief of the village. You question three inhabitants. Amar, Bobby and Charles. Only Bobby is wearing a red shirt.”
Amar says. “I am not Bobby’s son. The chief wears a red shirt.”
Bobby says, “I am Amar’s father. Charles is the chief.”
Charles says, “The chief is one among us. I am the chief.”
Who is the chief?
Study the graph below and answer the questions that follow.
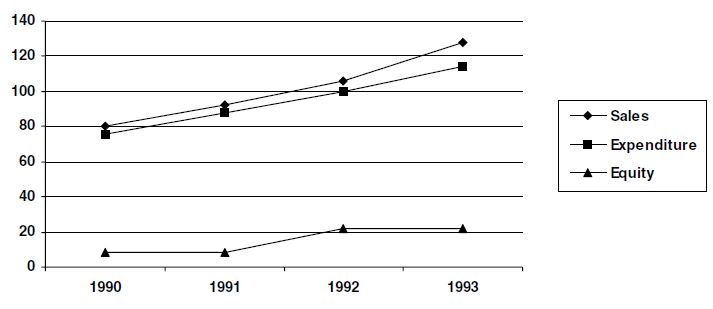
Profit is defined as Sales - Expenditure
In which year is the profit per rupee of equity the highest?
Study the graph below and answer the questions that follow.
Profit is defined as Sales - Expenditure
The simple annual growth rate in sales was the highest between the years?
Study the graph below and answer the questions that follow.
Profit is defined as Sales - Expenditure
In which year is the sales per rupee of expenditure the lowest?
Study the graph below and answer the questions that follow.
Profit is defined as Sales - Expenditure
In which year is sales per rupee of equity the highest?
Ghosh Babu has recently acquired four companies namely Arc – Net Technologies (ANT), Babu Anta Transport (BAT), Charles Anter Tailor (CAT) and Daud Akbar Transistors (DAT). When the results of the companies for the year 1992 – 93 were placed before him. He found a few interesting things about them. While the profits of CAT and DAT were the same, the sales of CAT were the same as those of BAT . Profits of ANT were 10% of its sales, where as the profits of BAT were 20% of its sales. While the total expenses of CAT were 5 times its profits, sales of DAT were 3 times its profits. The total expenses of CAT were Rs.10,00,000, the total expenses of ANT were 10% less than those of CAT. Profits are defined as the difference between sales and total expenses.
Which company had the lowest sales?
Ghosh Babu has recently acquired four companies namely Arc – Net Technologies (ANT), Babu Anta Transport (BAT), Charles Anter Tailor (CAT) and Daud Akbar Transistors (DAT). When the results of the companies for the year 1992 – 93 were placed before him. He found a few interesting things about them. While the profits of CAT and DAT were the same, the sales of CAT were the same as those of BAT . Profits of ANT were 10% of its sales, where as the profits of BAT were 20% of its sales. While the total expenses of CAT were 5 times its profits, sales of DAT were 3 times its profits. The total expenses of CAT were Rs.10,00,000, the total expenses of ANT were 10% less than those of CAT. Profits are defined as the difference between sales and total expenses.
Which company had the highest total expenses?
Ghosh Babu has recently acquired four companies namely Arc – Net Technologies (ANT), Babu Anta Transport (BAT), Charles Anter Tailor (CAT) and Daud Akbar Transistors (DAT). When the results of the companies for the year 1992 – 93 were placed before him. He found a few interesting things about them. While the profits of CAT and DAT were the same, the sales of CAT were the same as those of BAT . Profits of ANT were 10% of its sales, where as the profits of BAT were 20% of its sales. While the total expenses of CAT were 5 times its profits, sales of DAT were 3 times its profits. The total expenses of CAT were Rs.10,00,000, the total expenses of ANT were 10% less than those of CAT. Profits are defined as the difference between sales and total expenses.
Which company had the lowest profits?
Ghosh Babu has recently acquired four companies namely Arc – Net Technologies (ANT), Babu Anta Transport (BAT), Charles Anter Tailor (CAT) and Daud Akbar Transistors (DAT). When the results of the companies for the year 1992 – 93 were placed before him. He found a few interesting things about them. While the profits of CAT and DAT were the same, the sales of CAT were the same as those of BAT . Profits of ANT were 10% of its sales, where as the profits of BAT were 20% of its sales. While the total expenses of CAT were 5 times its profits, sales of DAT were 3 times its profits. The total expenses of CAT were Rs.10,00,000, the total expenses of ANT were 10% less than those of CAT. Profits are defined as the difference between sales and total expenses.
Which company had the highest profits.
Study the graph below and answer the questions.
Total Assets are defined as Net Fixed Assets + Net Current Assets + Investments
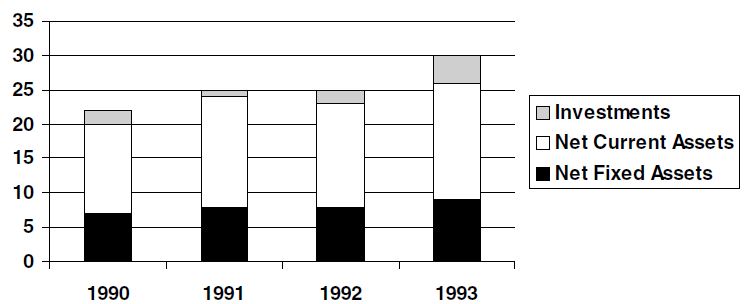
What is the approximate simple annual growth rate of Total Assets 1990 and 1993?
Study the graph below and answer the questions.
Total Assets are defined as Net Fixed Assets + Net Current Assets + Investments
In any two consecutive years, the growth rate is lowest for
Study the graph below and answer the questions.
Total Assets are defined as Net Fixed Assets + Net Current Assets + Investments
Between 1991 and 1992, the highest growth rate was seen for
Study the graph below and answer the questions.
Total Assets are defined as Net Fixed Assets + Net Current Assets + Investments
The only item which has not shown a negative growth in every year between 1990 and 1993 is
Use the following information:
Swetha, Swarna, Sneha and Soumya are four sisters who have an agreement that they share all snacks equally among themselves. One day, uncle Prem gave a box of cookies to Swetha. Since the other sisters were not around, Swetha divided the cookies into four parts, ate her share and put the rest into the box. As she was closing the box, Swarna came in, She took all the cookies from the box and divided them into four equal parts. Swetha and Swarna ate one part each and put the rest into the box. Just then Sneha walked in. She took all the cookies from the box, divided them into four equal parts. The three of them ate their respective shares and put the rest into the box. Later, when Soumya came, she divided all the cookies into four equal parts and all the four sisters ate their respective shares. In total, Soumya ate 3 cookies.
How many cookies, in total, did Sneha eat?
Use the following information:
Swetha, Swarna, Sneha and Soumya are four sisters who have an agreement that they share all snacks equally among themselves. One day, uncle Prem gave a box of cookies to Swetha. Since the other sisters were not around, Swetha divided the cookies into four parts, ate her share and put the rest into the box. As she was closing the box, Swarna came in, She took all the cookies from the box and divided them into four equal parts. Swetha and Swarna ate one part each and put the rest into the box. Just then Sneha walked in. She took all the cookies from the box, divided them into four equal parts. The three of them ate their respective shares and put the rest into the box. Later, when Soumya came, she divided all the cookies into four equal parts and all the four sisters ate their respective shares. In total, Soumya ate 3 cookies.
How many cookies did uncle Prem give to Swetha?
Use the following information:
Swetha, Swarna, Sneha and Soumya are four sisters who have an agreement that they share all snacks equally among themselves. One day, uncle Prem gave a box of cookies to Swetha. Since the other sisters were not around, Swetha divided the cookies into four parts, ate her share and put the rest into the box. As she was closing the box, Swarna came in, She took all the cookies from the box and divided them into four equal parts. Swetha and Swarna ate one part each and put the rest into the box. Just then Sneha walked in. She took all the cookies from the box, divided them into four equal parts. The three of them ate their respective shares and put the rest into the box. Later, when Soumya came, she divided all the cookies into four equal parts and all the four sisters ate their respective shares. In total, Soumya ate 3 cookies.
How many cookies, in total, did Swetha eat?
Use the following information:
Swetha, Swarna, Sneha and Soumya are four sisters who have an agreement that they share all snacks equally among themselves. One day, uncle Prem gave a box of cookies to Swetha. Since the other sisters were not around, Swetha divided the cookies into four parts, ate her share and put the rest into the box. As she was closing the box, Swarna came in, She took all the cookies from the box and divided them into four equal parts. Swetha and Swarna ate one part each and put the rest into the box. Just then Sneha walked in. She took all the cookies from the box, divided them into four equal parts. The three of them ate their respective shares and put the rest into the box. Later, when Soumya came, she divided all the cookies into four equal parts and all the four sisters ate their respective shares. In total, Soumya ate 3 cookies.
How many cookies, in total, did Swarna eat?
Use the following information:
A professor keeps data on students tabulated by performance and sex of the student . The data is kept on
a computer disk, but unfortunately some of it is lost because of a virus. Only the following could be
recovered :
âââââââ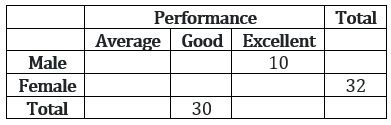 âââââââ
Panic buttons were pressed but to no avail. An expert committee was formed, which decided that the following facts were self evident:
- Half the students were either excellent or good.
- 40% of the students were females.
- One third of the male students were average.
How many students were both female and excellent?
Use the following information:
A professor keeps data on students tabulated by performance and sex of the student . The data is kept on
a computer disk, but unfortunately some of it is lost because of a virus. Only the following could be
recovered :
ââââââââââââââ
Panic buttons were pressed but to no avail. An expert committee was formed, which decided that the following facts were self evident:
- Half the students were either excellent or good.
- 40% of the students were females.
- One third of the male students were average.
How many students were both male and good?
Use the following information:
A professor keeps data on students tabulated by performance and sex of the student . The data is kept on
a computer disk, but unfortunately some of it is lost because of a virus. Only the following could be
recovered :
ââââââââââââââ
Panic buttons were pressed but to no avail. An expert committee was formed, which decided that the following facts were self evident:
- Half the students were either excellent or good.
- 40% of the students were females.
- One third of the male students were average.
Among average students, what was the ratio of male to female?
Use the following information:
A professor keeps data on students tabulated by performance and sex of the student . The data is kept on
a computer disk, but unfortunately some of it is lost because of a virus. Only the following could be
recovered :
ââââââââââââââ
Panic buttons were pressed but to no avail. An expert committee was formed, which decided that the following facts were self evident:
- Half the students were either excellent or good.
- 40% of the students were females.
- One third of the male students were average.
What proportion of female students were good?
Use the following information:
A professor keeps data on students tabulated by performance and sex of the student . The data is kept on
a computer disk, but unfortunately some of it is lost because of a virus. Only the following could be
recovered :
ââââââââââââââ
Panic buttons were pressed but to no avail. An expert committee was formed, which decided that the following facts were self evident:
- Half the students were either excellent or good.
- 40% of the students were females.
- One third of the male students were average.
What proportion of good students were male?
Given below are the forecasts of the World and Asian energy demand for the years 1990, 2000 and 2010 AD. The demand is given in million barrels per day, crude oil equivalent.âââââââ
âââââââ ââââââââââââââ
Over 1990 – 2010, which two fuels meet more than 60 percent of the total energy demand of both World and Asia?
Given below are the forecasts of the World and Asian energy demand for the years 1990, 2000 and 2010 AD. The demand is given in million barrels per day, crude oil equivalent.âââââââ
âââââââââââââââââââââ
Which fuel’s proportion in the total energy demand increases over the decade 1990–2000 and decreases over the decade 2000 – 2010 for both the World and Asia?
Given below are the forecasts of the World and Asian energy demand for the years 1990, 2000 and 2010 AD. The demand is given in million barrels per day, crude oil equivalent.âââââââ
âââââââââââââââââââââ
Which is the fuel whose proportion in the total energy demand will decrease continuously over the period 1990 – 2010, in Asia?
Given below are the forecasts of the World and Asian energy demand for the years 1990, 2000 and 2010 AD. The demand is given in million barrels per day, crude oil equivalent.âââââââ
âââââââââââââââââââââ
Which is the fuel whose proportion to the total energy demand of the world will remain constant over the period 1990 – 2010 but whose proportion will increase in the total energy demand in Asia?