CAT 1995 — DILR Question 21
Bar GraphsEasy
Passage / Data
Direction: Answer the questions based on the following graph.
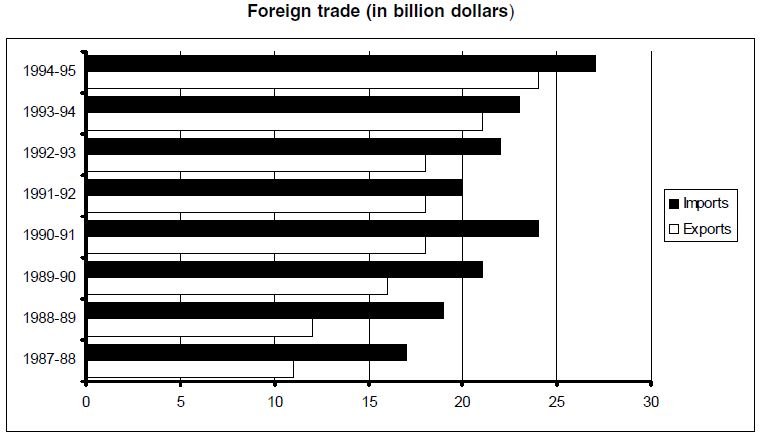
In which year was the trade deficit highest?
Answer & solution
Correct answer: 1988-89
- A
1987-88
1988-89
- C
1989-90
- D
1990-91
Solution
The graph given in the question can be expressed as a table given below.
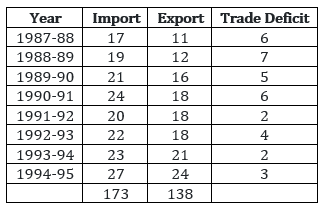
Trade deficit = Imports – Exports, was the highest for the year 1988-89, viz. 7 billion dollars.
Related Bar Graphs questions
- In how many years was the trade deficit less than the trade deficit in the succe…
- Export earning in 1990-91 is how many per cent of imports in 1991-92?…
- In the last three years, the total export earnings have accounted for how many p…
- Which of the following statements can be inferred from the graph? I. In all the …
- Which year shows the highest change in revenue obtained from journals?…
- In 1992, what per cent of the total revenue came from books?…