CAT 1995 — DILR Question 25
Direction: Answer the questions based on the following graph.
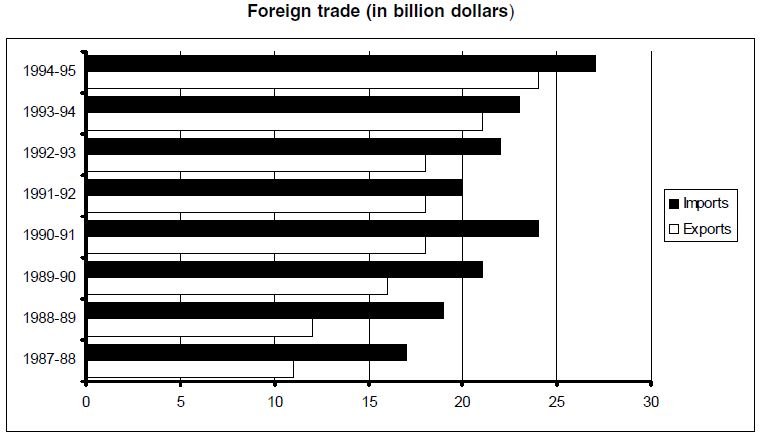
Which of the following statements can be inferred from the graph?
I. In all the years shown in the graph, the trade deficit is less than the export earning.
II. Export earnings increased in every year between 1989-90 and 1991-92.
III. In all the years shown in the graph, the earning by exports is less than the expenditure on imports in the preceding year.
Answer & solution
Correct answer: I only
I only
- B
II only
- C
III only
- D
I and III only
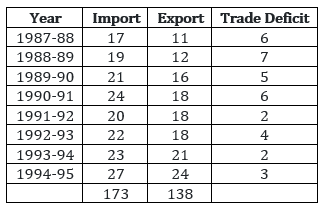
The first statement is obviously true as the trade deficit in each year is less than the export earning. The export earning has remained constant for three years between 1990 and 1993. Hence, statement II is not true. Even statement III is not true as the exports in 1994-95 is more than the imports in 1993-94.
Related Bar Graphs questions
- In which year was the trade deficit highest?…
- In how many years was the trade deficit less than the trade deficit in the succe…
- Export earning in 1990-91 is how many per cent of imports in 1991-92?…
- In the last three years, the total export earnings have accounted for how many p…
- Which year shows the highest change in revenue obtained from journals?…
- In 1992, what per cent of the total revenue came from books?…