CAT 1999 — DILR Question 33
Directions: Answer the questions based on the following information
Consider the information provided in the figure below relating to India’s foreign trade in 1997-98 and the first eight months of 1998-99. Total trade with a region is defined as the sum of exports and imports from that region. Trade deficit is defined as the excess of imports over exports. Trade deficit may be negative.
A.USA G. Other East European countries
B. Germany H. OPEC
C. Other EU I. Asia
D.UK J. Other LDCs
E. Japan K. Others
F. Russia
| Source of Imports | |
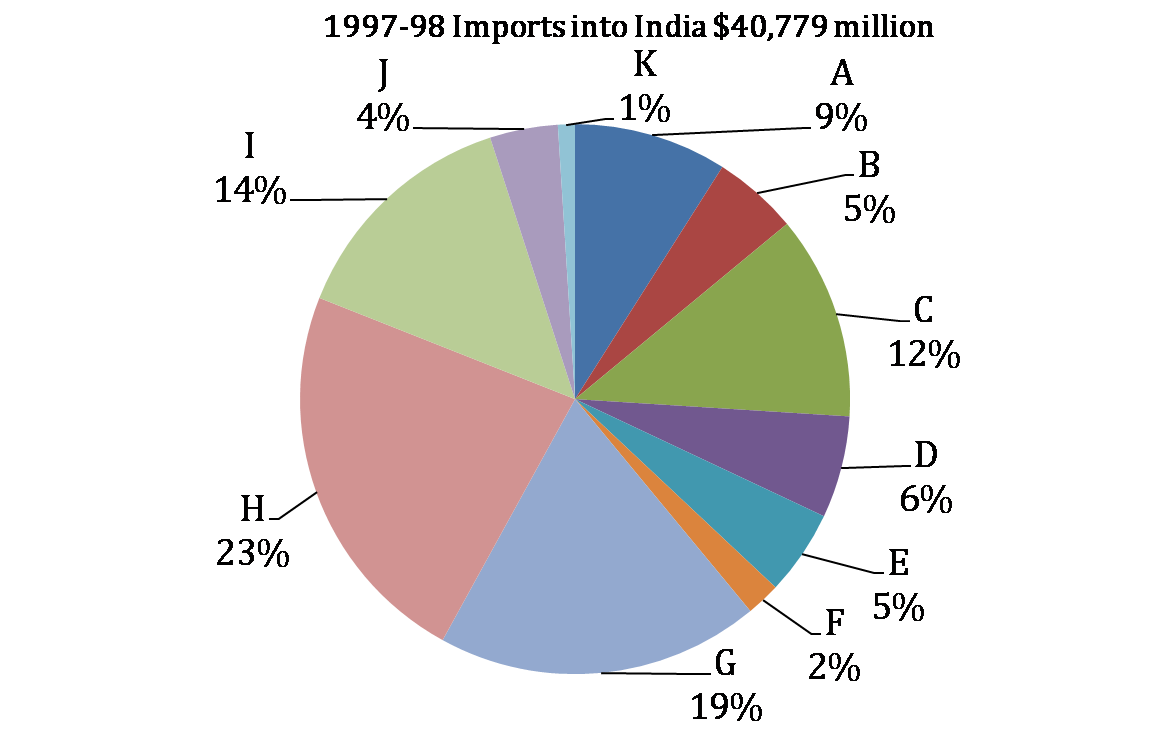 |
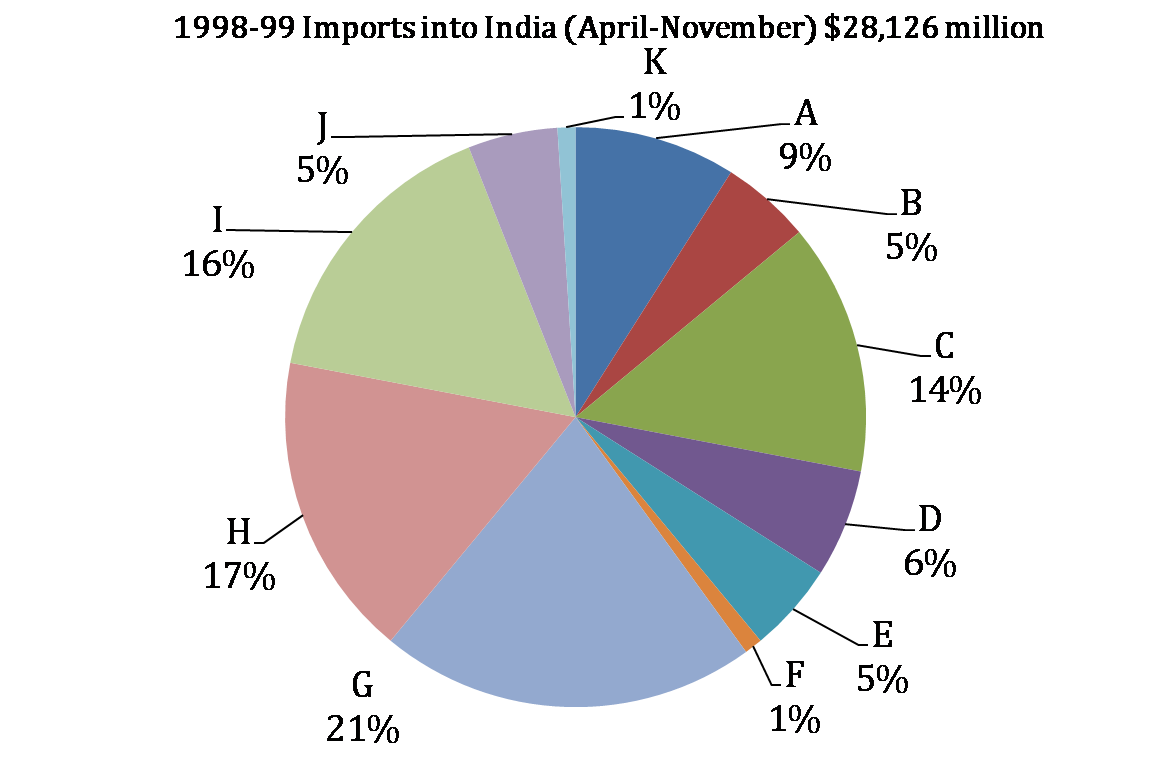 |
| Destination of exports | |
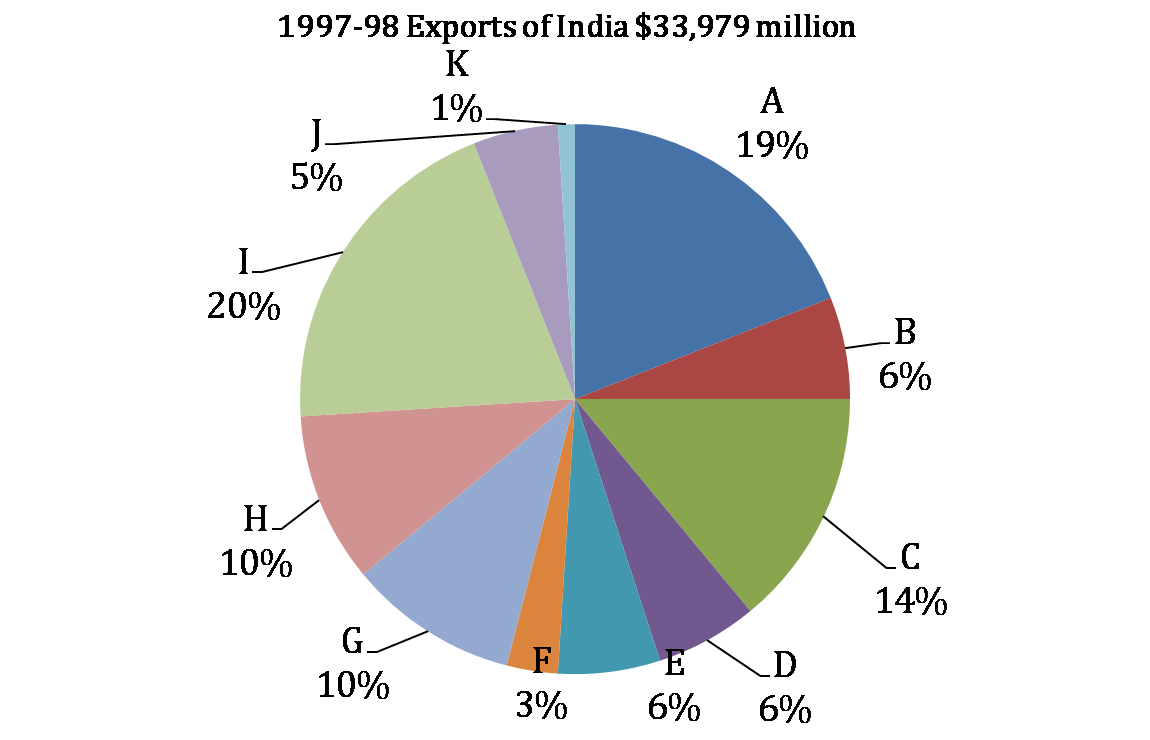 |
 |
Additional directions: Assume that the average monthly exports from India and imports to India during the remaining four months of 1998-99 would be the same as that for the first eight months of the year.
What is the region to which India’s exports registered the highest percentage growth between 1997-98 and 1998-99?
Answer & solution
- A
Other East European countries
USA
- C
Asia
- D
Exports have declined, no growth
From the pie chart, we know that the exports have increased from three regions A, G and H as follows.
 âââââââ
Also the exports for 8 months have been given.
According to new directions, before question 143, we need to calculate exports for 12 months
= $32,154 million.
The maximum percentage increase is therefore from region A.