CAT 2000 — DILR Question 23
Answer the following question based on the information given below.
The table shows trends in external transactions of Indian corporate sector during the period 1993-94 to 1997-98. In addition, following definitions hold good.
Salesi , Importsi, and Exportsi respectively denote the sales, imports and exports in year i.
Deficit in year i, Deficiti = Importsi – Exportsi.
Deficit Intensity in year i, DIi = Deficiti / Salesi.
Growth rate of deficit intensity in year i, GDIi = (DIi – DIi-1)/DIi-1
Further, note that all imports are classified as either raw material or capital goods.
Trends in External Transactions of Indian Corporate Sector (All figures in %)
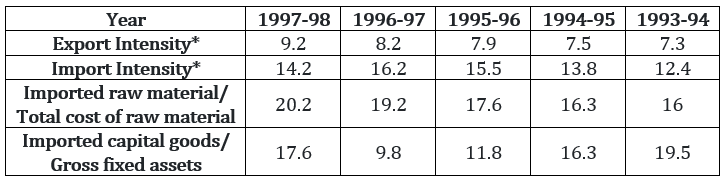
Which of the following statements can be inferred to be true from the given data?
Answer & solution
Correct answer: Deficit intensity has increased every year between 1993-94 and 1996-97.
- A
During the 5 year period between 1993-94 and 1997-98, exports have increased every year.
- B
During the 5 year period between 1993-94 and 1997-98, imports have decreased every year.
- C
Deficit in 1997-98 was lower than that in 1993-94.
Deficit intensity has increased every year between 1993-94 and 1996-97.
Deficit intensity = = Import Intensity - Export Intensity

Growth rate in 1994-95 = ×100 = 23.5%
Growth rate in 1995-96 = ×100 = 20.63%
Growth rate in 1996-97 = × 100 = 5.26%
Growth rate in 1997-98 = ×100 = -37.5%
we can conclude that deficit intensity is increasing between 1993-94 and 1996-97.
Hence, option (a).
Related Tables questions
- Suppose the average employment level is 60 per factory. The average employment i…
- Among the firms in different sectors, value added per employee is highest in…
- Capital productivity is defined as the gross output value per rupee of fixed cap…
- A sector is considered “pareto efficient” if its value added per emp…
- The total value added in all sectors is estimated at Rs. 140,000 crores. Suppose…
- The value of the highest growth rate in deficit intensity is approximately…