CAT 2001 — DILR Question 22
Pie-ChartsEasy
Passage / Data
Answer the following question based on the information given below.
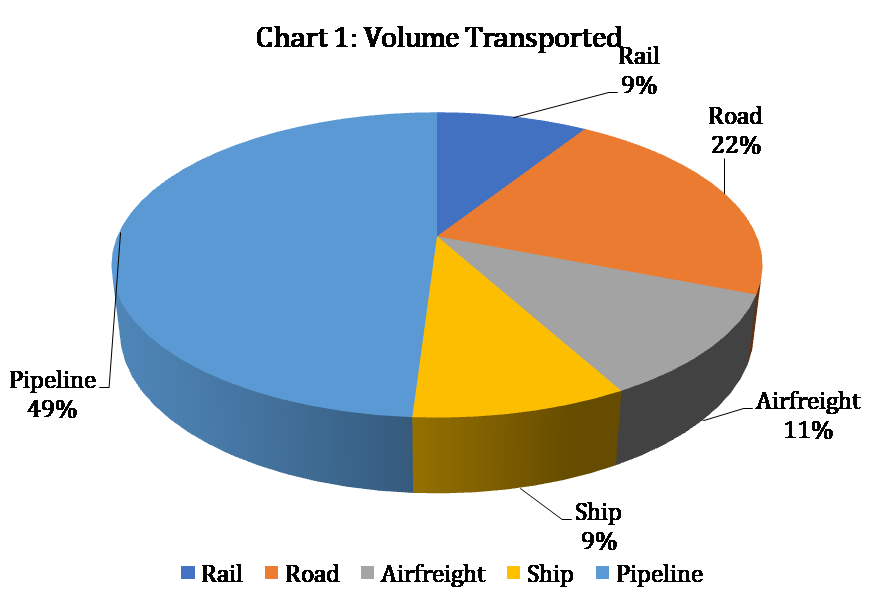
The questions are based on the pie charts given below. Chart 1 shows the distribution of twelve million tons of crude oil transported through different modes over a specific period of time. Chart 2 shows the distribution of the cost of transporting this crude oil. The total cost was Rs. 30 million.

From the charts given, it appears that the cheapest mode of transport is
Answer & solution
Road
- B
Rail
- C
Pipeline
- D
Ship
Solution
Ratio of the cost of transportation of crude oil per ton by Rail, Road, Ship and Pipeline are calculated below.
Here the smallest ratio is which corresponds to transportation of oil by Road.
∴ Road is the cheapest mode of the transport.
Hence, option (a).