CAT 2003 Slot 1 — DILR Question 10
Answer the following question based on the information given below.
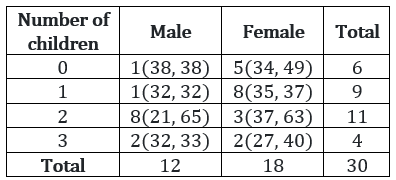
The table below provides certain demographic details of 30 respondents who were part of a survey. The demographic characteristics are: gender, number of children and age of respondents. The first number in each cell is the number of respondents in that group. The minimum and maximum age of respondents in each group is given in brackets. For example, there are five female respondents with no children and among these five, the youngest is 34 years old, while the oldest is 49.
 âââââââ
The percentage of respondents that fall into the 35 to 40 years age group (both inclusive) is at least ___.
Answer & solution
- A
6.67%
- B
10%
13.33%
- D
26.67%
Percentage of respondents in 35-40 years age group is at least
= 1 male (38, 38) with no children + 1 female with 1 child + 1 female with 2 children + 1 female with 3 children
= 4
∴ Required percentage = × 100 = 13.33%
Hence, option (c).