CAT 2003 Slot 2 — DILR Question 31
Pie-ChartsEasy
Passage / Data
Answer the following question based on the information given below.
Answer the questions on the basis of the following charts.
(Note: Availability is defined as production less export.)
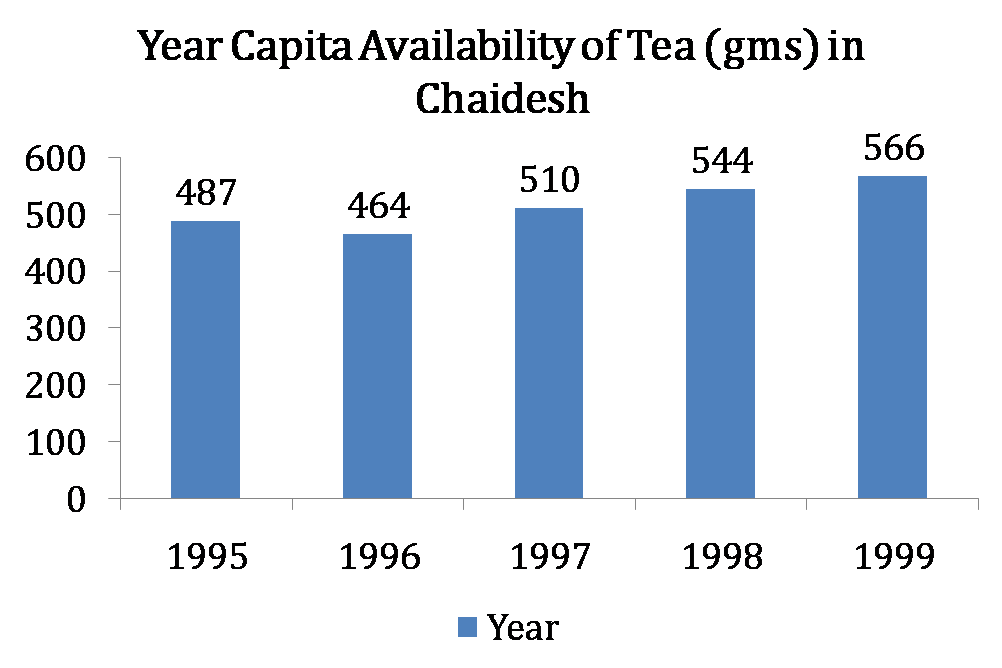

The area under tea cultivation continuously decreased in all four years from 1996 to 1999, by 10%, 7%, 4% and 1% respectively. In which year was tea productivity (production per unit of area) the highest?
Answer & solution
1999
- B
1998
- C
1997
- D
1996
Solution
Tea production is constantly increasing and the area under cultivation is decreasing.
Tea productivity =
âµ Production of tea is maximum in the year 1999, also the area under cultivation is the least in 1999.
∴ Tea productivity is the maximum for the year 1999.
Hence, option (a).