CAT 2019 Slot 2 — DILR Question 1
Answer the following questions based on the information given below.
To compare the rainfall data, India Meteorological Department (IMD) calculated the Long Period Average (LPA) of rainfall during period June-August for each of the 16 states. The figure given below shows the actual rainfall (measured in mm) during June-August, 2019 and the percentage deviations from LPA of respective states in 2018. Each state along with its actual rainfall is presented in the figure.
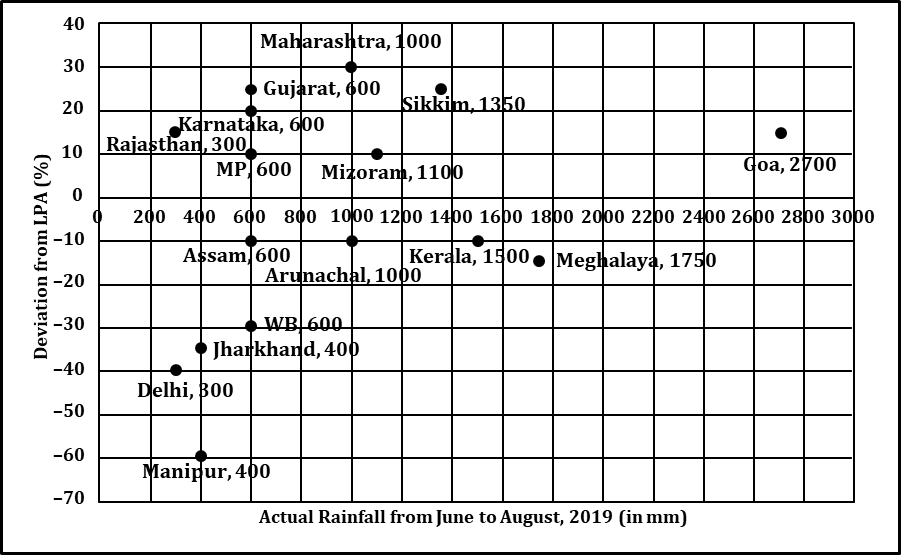
If a ‘Heavy Monsoon State’ is defined as a state with actual rainfall from June-August, 2019 of 900 mm or more, then approximately what percentage of ‘Heavy Monsoon States’ have a negative deviation from respective LPAs in 2019?
Answer & solution
- A
57.14
- B
14.29
- C
75.00
42.86
There are a total of 7 states which have actual rainfall greater than or equal to 900 mm.
Out of these only 3 have negative deviation. (Arunachal, Kerela and Meghalaya)
Required percentage = (3/7) × 100 ≈ 42.86%.
Hence, option (d).