CAT 2019 Slot 2 — DILR Question 4
Answer the following questions based on the information given below.
To compare the rainfall data, India Meteorological Department (IMD) calculated the Long Period Average (LPA) of rainfall during period June-August for each of the 16 states. The figure given below shows the actual rainfall (measured in mm) during June-August, 2019 and the percentage deviations from LPA of respective states in 2018. Each state along with its actual rainfall is presented in the figure.
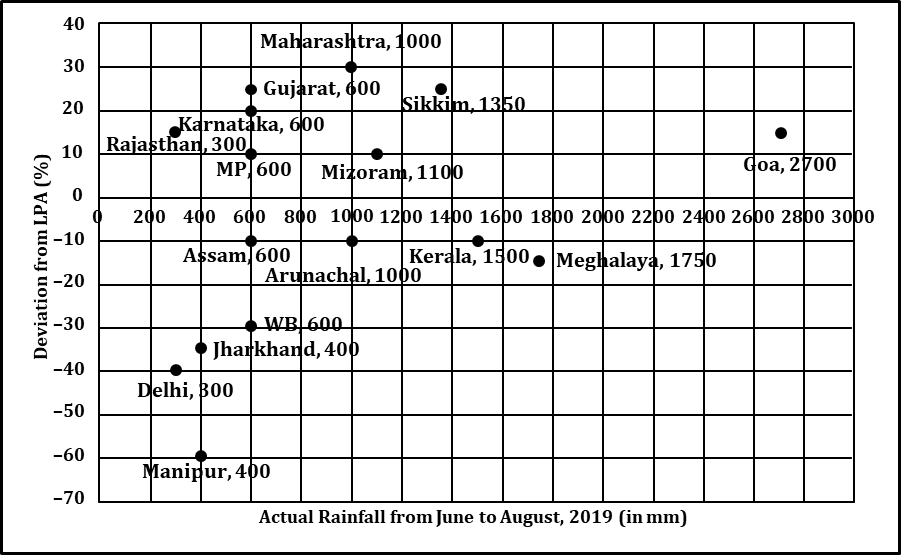
The LPA of a state for a year is defined as the average rainfall in the preceding 10 years considering the period of June-August. For example, LPA in 2018 is the average rainfall during 2009-2018 and LPA in 2019 is the average rainfall during 2010-2019. It is also observed that the actual rainfall in Gujarat in 2019 is 20% more than the rainfall in 2009. The LPA of Gujarat in 2019 is closest to
Answer & solution
- A
505 mm
- B
525 mm
490 mm
- D
475 mm
Actual rainfall in Gujarat in 2019 is 20% more than the rainfall in 2009.
So, considering Gujarat, Actual rainfall in 2019 = (6/5) × Actual rainfall in 2009 = 600 mm (given).
∴ Actual rainfall in 2009 = 500 mm.
As deviation for Gujarat is 25%, so average rainfall for 2009 to 2018 is 600/1.25 = 480 mm.
So, total rainfall from 2009 to 2018 = 480 × 10 = 4800 mm.
LPA for 2019 = (Rainfall in 2010 to 2019)/10 = [(Rainfall in 2009 to 2018) − Rainfall in 2009 + Rainfall in 2019]/10
= (4800 − 500 + 600)/10 = 490 mm.
Hence, option (c).