CAT 2022 Slot 3 — DILR Question 15
Answer the next 5 questions based on the information given below:
In the following, a year corresponds to 1st of January of that year.
A study to determine the mortality rate for a disease began in 1980. The study chose 1000 males and 1000 females and followed them for forty years or until they died, whichever came first. The 1000 males chosen in 1980 consisted of 250 each of ages 10 to less than 20, 20 to less than 30, 30 to less than 40, and 40 to less than 50. The 1000 females chosen in 1980 also consisted of 250 each of ages 10 to less than 20, 20 to less than 30, 30 to less than 40, and 40 to less than 50.
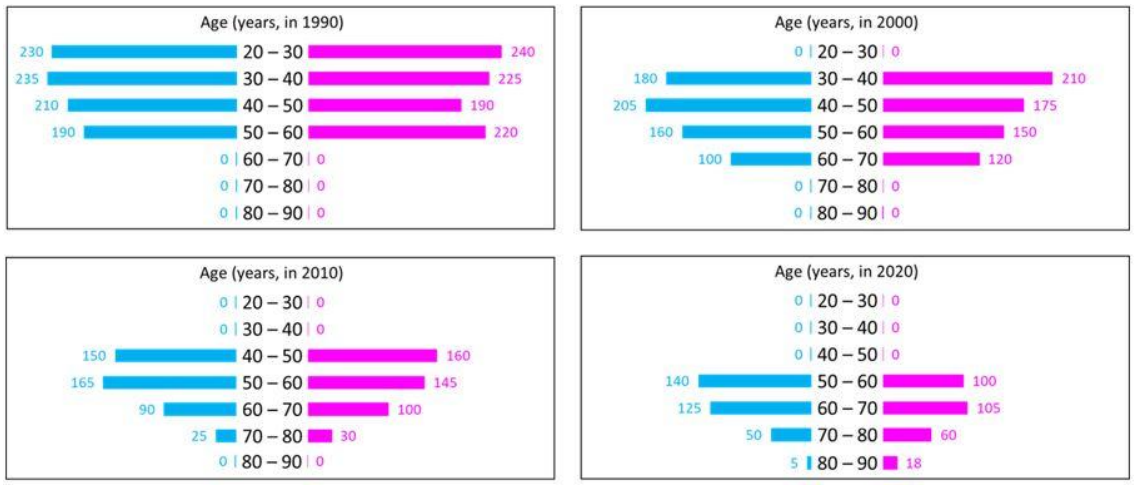
The four figures below depict the age profile of those among the 2000 individuals who were still alive in 1990, 2000, 2010, and 2020. The blue bars in each figure represent the number of males in each age group at that point in time, while the pink bars represent the number of females in each age group at that point in time. The numbers next to the bars give the exact numbers being represented by the bars. For example, we know that 230 males among those tracked and who were alive in 1990 were aged between 20 and 30.
 âââââââ
How many of the females who were being tracked and who were between 20 and 30 years of age in 1980 died between the ages of 50 and 60?
[Note: There is an ambiguity in this question and hence was discarded by IIM Bangalore.]
Answer & solution
Answer: 30
1980 age range 20-30 (500) is same as
2000 age range 40-50 (175) is same as
2010 age range 50-60 (145 females)
30 people from this category died from 2000 to 2010, but it is not necessary that they were between 50-60 years old.
Someone who was 41 years old in 2000 may have died before he/she attains the age of 50.
The answer to this question should be cannot be determined.
Hence, this question was discarded.
Note: Answer provided in Candidate response sheet is 30.