XAT 2011 — QA & DI Question 1
Simple EquationsEasy
Passage / Data
Answer the following question based on the information given below.
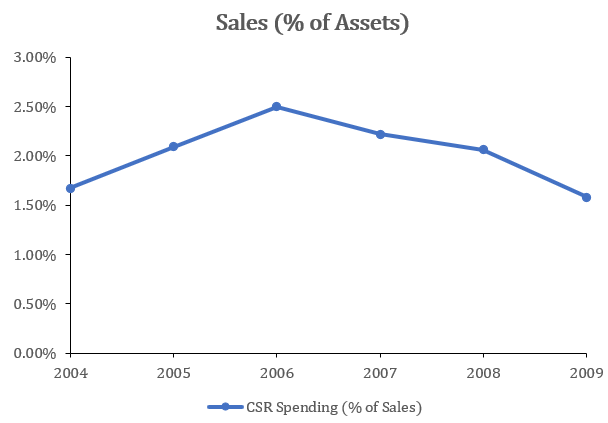
The following graphs give annual data of Assets, Sales (as percentage of Assets) and Spending on Corporate Social Responsibility (CSR) (as percentage of Sales), of a company for the period 2004 – 2009.


 âââââââ
In which year was the increase in spending on CSR, vis-à-vis the previous year, the maximum?
Answer & solution
- A
2005
2006
- C
2007
- D
2008
- E
2009
Solution
The data can be tabulated as follows:
 âââââââ
Hence, the increase in spending on CSR was the maximum in 2006.
Hence, option (b).