XAT 2011 — QA & DI Question 2
Simple EquationsEasy
Passage / Data
Answer the following question based on the information given below.
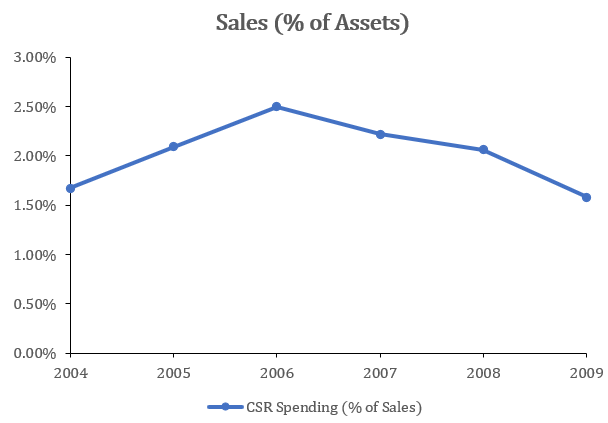
The following graphs give annual data of Assets, Sales (as percentage of Assets) and Spending on Corporate Social Responsibility (CSR) (as percentage of Sales), of a company for the period 2004 – 2009.


 âââââââ
Of the years indicated below, in which year was the ratio of CSR/Assets the maximum?
Answer & solution
- A
2004
- B
2005
- C
2006
- D
2007
2008
Solution
The ratio of CSR/Assets was the maximum in 2008 in the years given in the options.
Hence, option (e).