XAT 2017 — QA & DI Question 23
Answer the next 4 questions based on the following information:
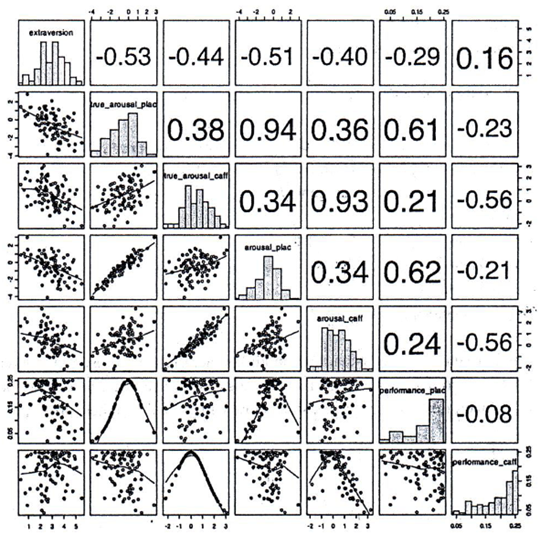
The grid below captures relationships among seven personality dimensions: "extraversion", "true_arousal_plac", "true_arousal_caff”, "arousal_plac", "arousal_caff”, "performance_plac", and "performance caff”. The diagonal represents histograms of the seven dimensions. Left of the diagonal represents scatterplots between the dimensions while the right of the diagonal represents quantitative relationships between the dimensions. The lines in the scatterplots are closest approximation of the points. The value of the relationships to the right of the diagonal can vary from -1 to +1, with -1 being the extreme linear negative relation and +1 extreme linear positive relation. (Axes of the graph are conventionally drawn).
 âââââââ
Which of the following is true?
Answer & solution
"Extraversion" has two modes.
- B
Median for "arousal_plac" is definitely the same as its average.
- C
Median for "arousal_caff" is definitely higher than its average.
- D
Median for "performance_plac" is definitely lower than its average.
- E
Median for "performance_caff" is definitely lower than its average.
We need to look at histogram to interpret the answer.
The histogram for performance_caff and performance_plac is left skewed which will shift median to right side compared to the mean.
The situation is opposite in case of arousal_caff.
Furthermore, arousal_plac‘s histogram is not symmetric and hence, there is no guarantee of its mean and median being equal.
Hence, options 2, 3, 4 and 5 are incorrect.
Hence, option (a).