XAT 2017 — QA & DI Question 25
Answer the next 4 questions based on the following information:
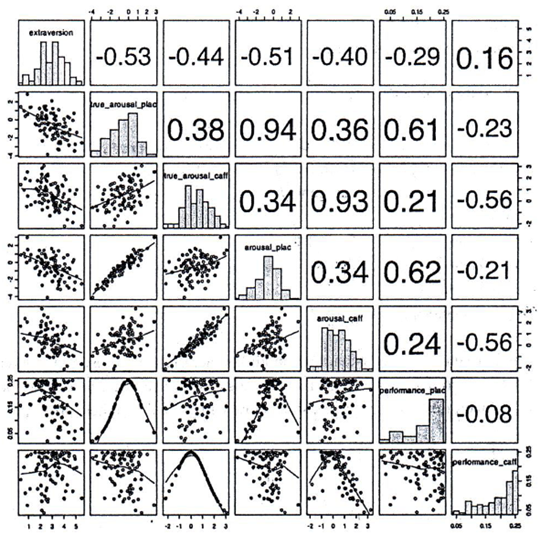
The grid below captures relationships among seven personality dimensions: "extraversion", "true_arousal_plac", "true_arousal_caff”, "arousal_plac", "arousal_caff”, "performance_plac", and "performance caff”. The diagonal represents histograms of the seven dimensions. Left of the diagonal represents scatterplots between the dimensions while the right of the diagonal represents quantitative relationships between the dimensions. The lines in the scatterplots are closest approximation of the points. The value of the relationships to the right of the diagonal can vary from -1 to +1, with -1 being the extreme linear negative relation and +1 extreme linear positive relation. (Axes of the graph are conventionally drawn).
 âââââââ
In which of the following scatterplots, the value of one dimension can be used to predict the value of another, as accurately as possible?
Answer & solution
- A
"extraversion" and "true_ arousal_caff'
- B
"true_arousal_plac" and “arousal_plac"
"true_arousal_plac" and "performance_plac"
- D
"true_arousal_plac" and "performancc_caff"
- E
All the above are irrelevant relations.
The question can be answered by looking at the scatterplot, which is on the left hand side of the diagonal.
Option (a) is weak as the scatter is dispersed all over.
Option (b) is very close, but some dispersion can be seen away from the trend line.
The scatterplot in the option (d) is dispersed as well and hence it cannot be right answer.
The scatterplot in the option (c) is indeed the closest to the trend line and hence it should be the answer, though the relationship is weaker as compared to that in the option (b) (This is because it is curvilinear in shape, while relationship value assumes linearity)
Hence, option (c).