CAT 1991 — DILR Question 26
Bar GraphsEasy
Passage / Data
Study the following graph and answer questions that follow. The x – axis denotes the years from 1983 to 1991.
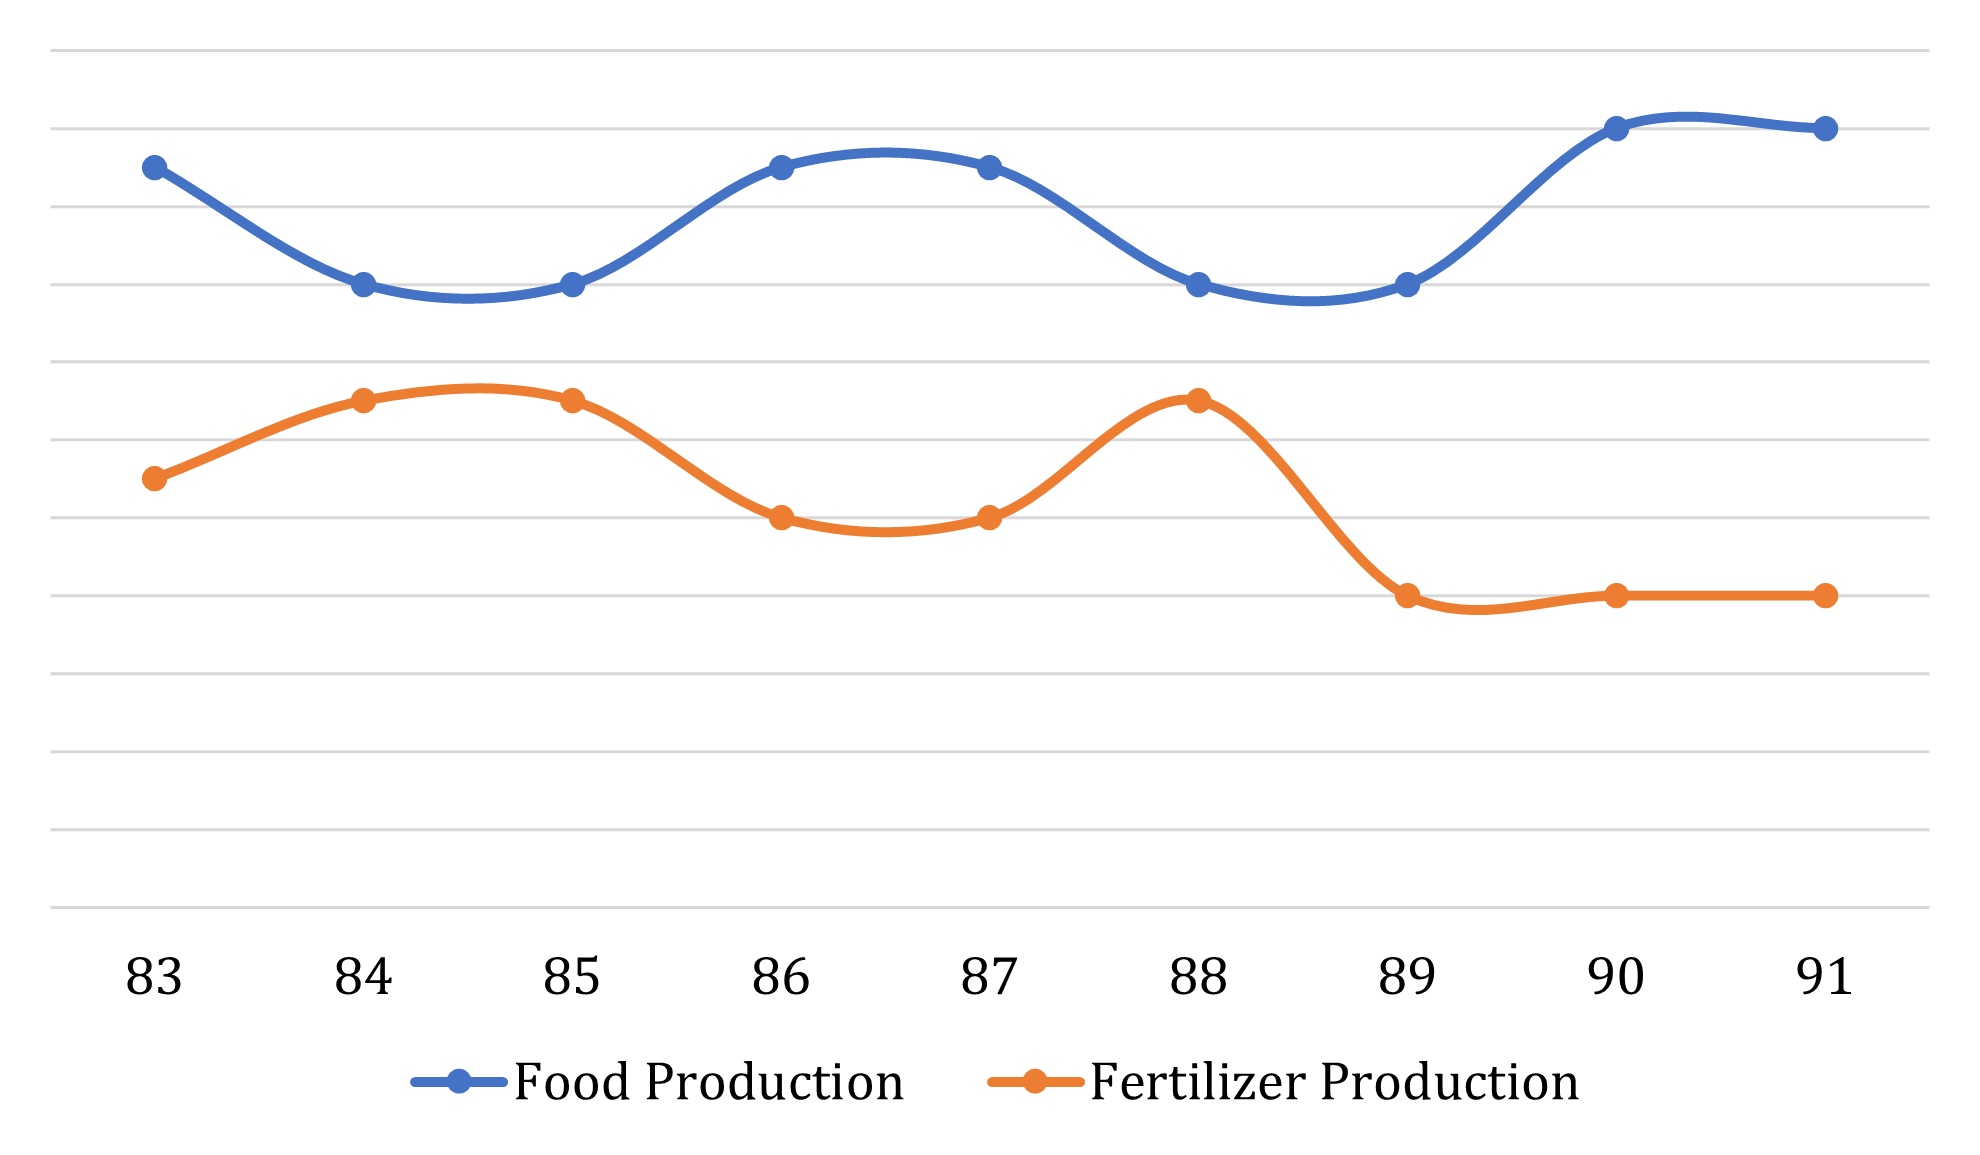
The sum of food and fertilizer production has shown a constant value for how many years?
Answer & solution
- A
None of the years
- B
2
- C
4
5
Solution
Students please note that the values on the Y-axis are not given. For the sake of convenience let us assume that one step on y-axis is ‘x’ and starting value be k.
 âââââââ
If you see, for each year from 1984 to 1988 sum of food and fertilizers = 14.5x + 2k. Hence, it is constant for 5 years.
Hence, option (d).