CAT 1991 — DILR Question 27
Bar GraphsEasy
Passage / Data
Study the following graph and answer questions that follow. The x – axis denotes the years from 1983 to 1991.
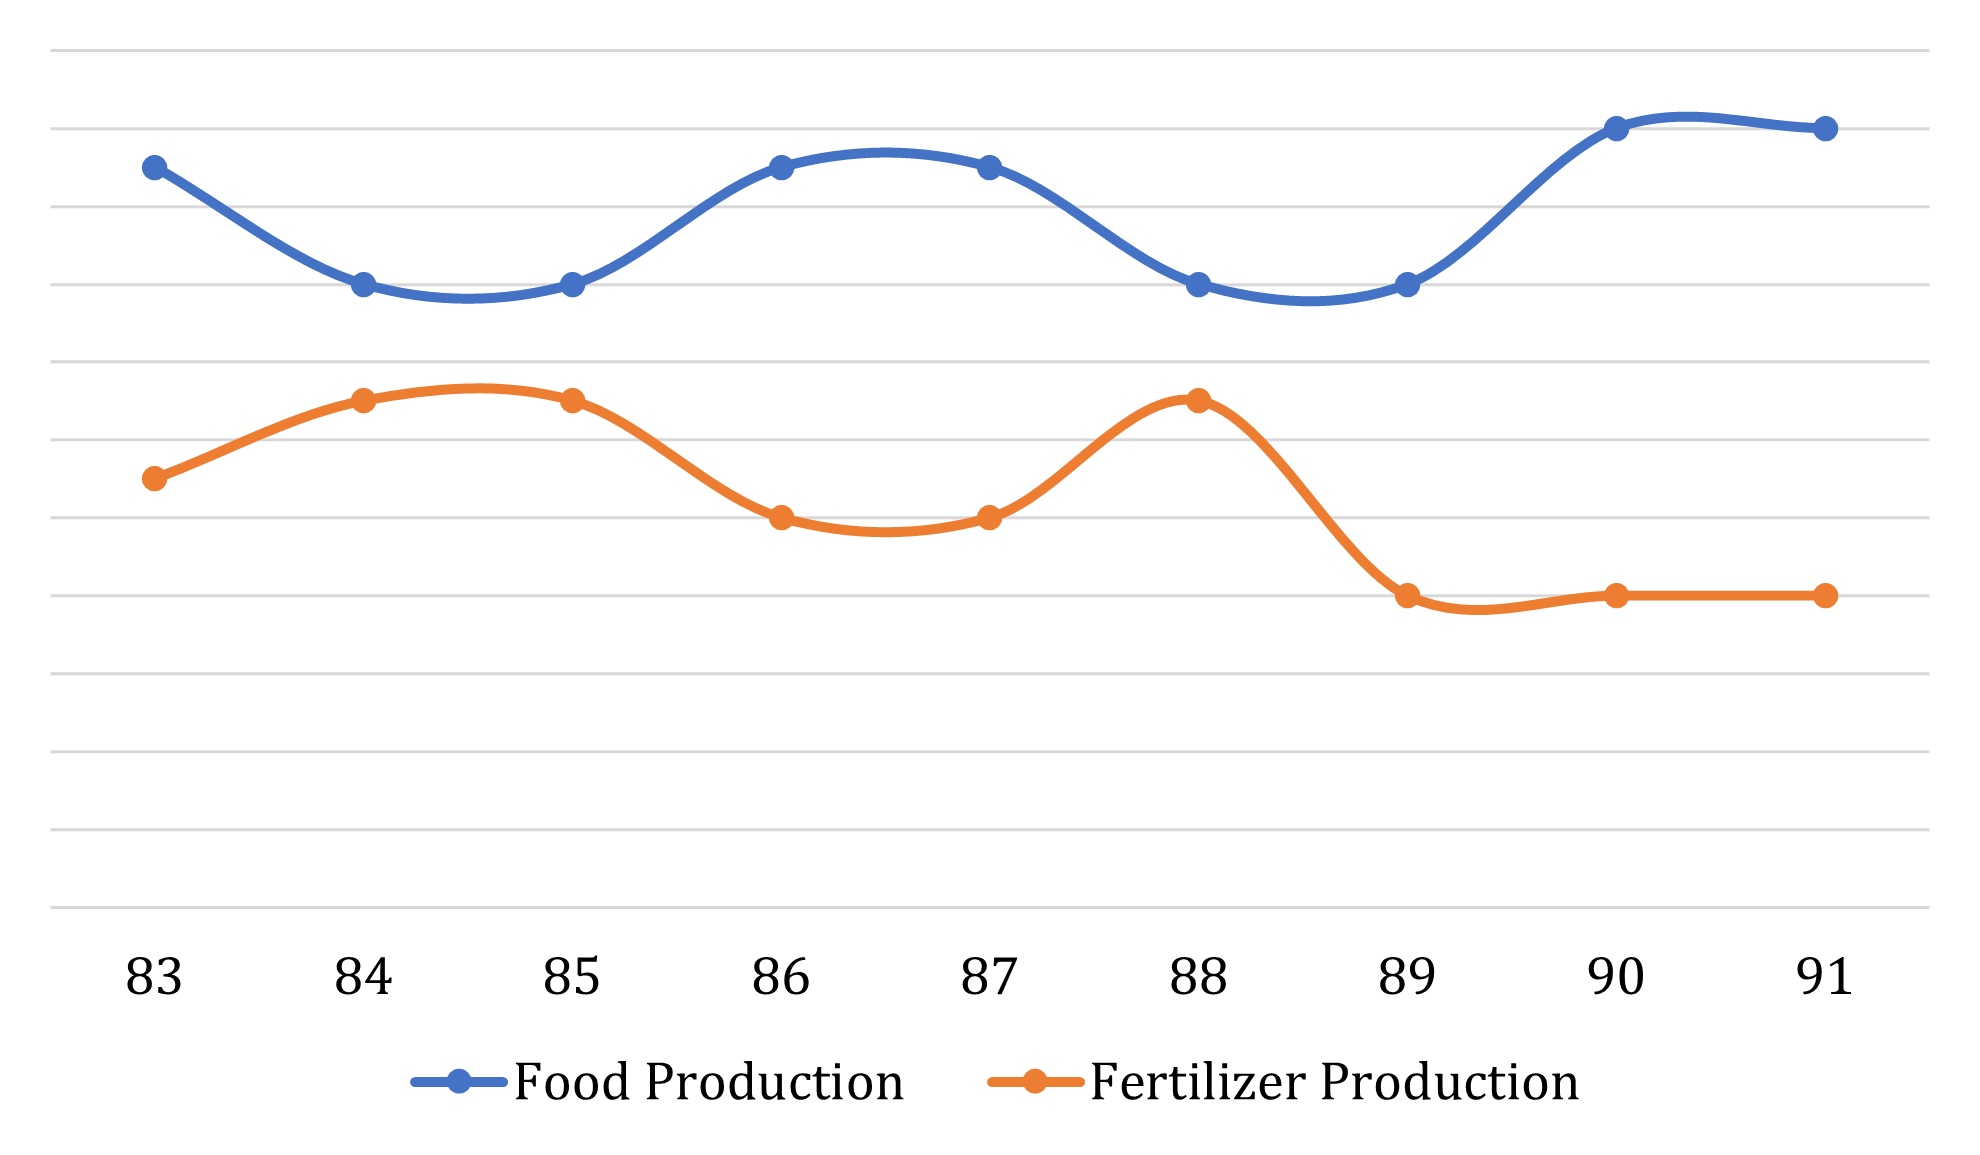
If in 1988, the sum of the food and fertilizer production was 170 million tonnes, the value of food production must have been (approximately, in million tonnes) …
Answer & solution
- A
90
- B
70
- C
100
Insufficient data
Solution
Fertilizers production in 1988 = 6.5x + k
Food production in 1988 = 8x + k
As per the given information
14.5x + 2k = 170
Value of x and k cannot be determined.
Hence, option (d).