CAT 1991 — DILR
All 32 DILR questions from CAT 1991, with the answer key and detailed solutions. Practise free — check answers as you go, or tap Show solution.
CAT 1991 · DILR
Each of these questions contains six statements followed by four sets of combinations of three. Choose the set in which the statements are logically related.
- No attendants are qualified.
- Some nurses are qualified.
- Some nurses are not qualified.
- All nurses are attendants.
- All attendants are qualified.
- Some attendants are qualified.
This question contains six statements followed by four sets of combinations of three. Choose the set in which the statements are logically related.
- Mary is John’s wife.
- Mary and John danced together.
- Mary wears John’s ring.
- Husband and wives danced the last waltz.
- John loves Mary.
- John danced last with Mary
This question contains six statements followed by four sets of combinations of three. Choose the set in which the statements are logically related.
- All roses are fragrant.
- All roses are majestic.
- All roses are plants.
- All plants need air.
- All roses need air.
- All plants need water.
This question contains six statements followed by four sets of combinations of three. Choose the set in which the statements are logically related
- Laxman is a man.
- Meera is Laxman’s wife.
- Some women are islands.
- No man is an island.
- Meera is not an island.
- Laxman is not a island.
This question contains six statements followed by four sets of combinations of three. Choose the set in which the statements are logically related
- College students are intelligent.
- Intelligence is a collegian’s attribute.
- Ram’s sister is a college student.
- Ram is a college student.
- All intelligent persons go to college.
- Ram is an intelligent person.
This question contains six statements followed by four sets of combinations of three. Choose the set in which the statements are logically related
- Smoking causes cancer.
- All cigarettes are hazardous to health.
- Smoking doesn’t cause cancer sometimes.
- One brand of cigarettes is cham – cham.
- Brand X causes cancer.
- Cham – cham is bad for health
This question contains six statements followed by four sets of combinations of three. Choose the set in which the statements are logically related
- All good bridge players play good chess.
- Many good chess players are not bridge players.
- Goren is a good bridge player.
- Goren plays chess well.
- Spassky plays chess well.
- Spassky plays bridge badly.
This question contains six statements followed by four sets of combinations of three. Choose the set in which the statements are logically related
- All snakes are reptiles.
- All reptiles are not snakes.
- All reptiles are cold blooded.
- All snakes lay eggs.
- All reptiles lay eggs.
- Snakes are cold blooded.
This question contains six statements followed by four sets of combinations of three. Choose the set in which the statements are logically related
- All leaves are green.
- All leaves have chlorophyll.
- Chlorophyll is green.
- All plants have leaves.
- All plants have chlorophyll.
- Only leaves have chlorophyll.
This question contains six statements followed by four sets of combinations of three. Choose the set in which the statements are logically related
- Some men are bald.
- Bald people are intelligent.
- Raman is a man.
- Raman is bald.
- Raman is intelligent.
- All men are intelligent.
This question contains six statements followed by four sets of combinations of three. Choose the set in which the statements are logically related
- No barbarian is gentleman.
- Some gentlemen are barbarians.
- Some gentlemen are rude.
- No gentlemen are rude.
- Some barbarians are not rude.
- All barbarians are rude.
This question contains six statements followed by four sets of combinations of three. Choose the set in which the statements are logically related
- Metal is good material for desks.
- Desks are made of metal.
- This object is not a desk.
- This object is a desk.
- This object is not made of metal.
- This is made of metal.
This question contains six statements followed by four sets of combinations of three. Choose the set in which the statements are logically related
- Mathew and Paul are brothers.
- Siblings are known to quarrel often.
- Mathew and Paul don’t quarrel.
- All those who quarrel are siblings.
- Paul and Mathew quarrel often.
- Mathew and Paul cannot be siblings.
This question contains six statements followed by four sets of combinations of three. Choose the set in which the statements are logically related
- Painting and music is art.
- Art is symptom of culture.
- Culture and art are complementary.
- Music is a form of art.
- Painting is a form of art.
- Music shows culture.
This question contains six statements followed by four sets of combinations of three. Choose the set in which the statements are logically related
- Different hues are obtained from primary colours.
- A rainbow consists of several hues.
- Blue and red can give different hues.
- Red is a primary color.
- Blue can give different hues.
- Red can give different hues.
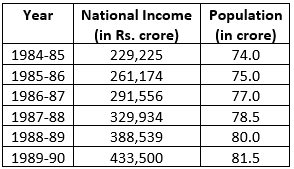
The following table gives the national income and the population of a country for the years 1984 – 85 to 1989 – 90. For each o the following questions choose the best alternative:
 âââââââ
The increase in the per capita income compared to the previous year is lowest for the year :
The following table gives the national income and the population of a country for the years 1984 – 85 to 1989 – 90. For each o the following questions choose the best alternative:
âââââââ
The per capita income is highest for the year :
The following table gives the national income and the population of a country for the years 1984 – 85 to 1989 – 90. For each o the following questions choose the best alternative:
âââââââ
The difference between the percentage increase in per capita income and the percentage increase in the population compared to the previous year is highest for the year:
The following table gives the national income and the population of a country for the years 1984 – 85 to 1989 – 90. For each o the following questions choose the best alternative:
âââââââ
The rate of increase in population was lowest in the year:
The following table gives the national income and the population of a country for the years 1984 – 85 to 1989 – 90. For each o the following questions choose the best alternative:
âââââââ
Increase in the per capita income compared to the previous year among the years given below was highest for the year:
The graph below shows the end of the month market values of 4 shares for the period from January to June. Answer the following questions based on this graph.
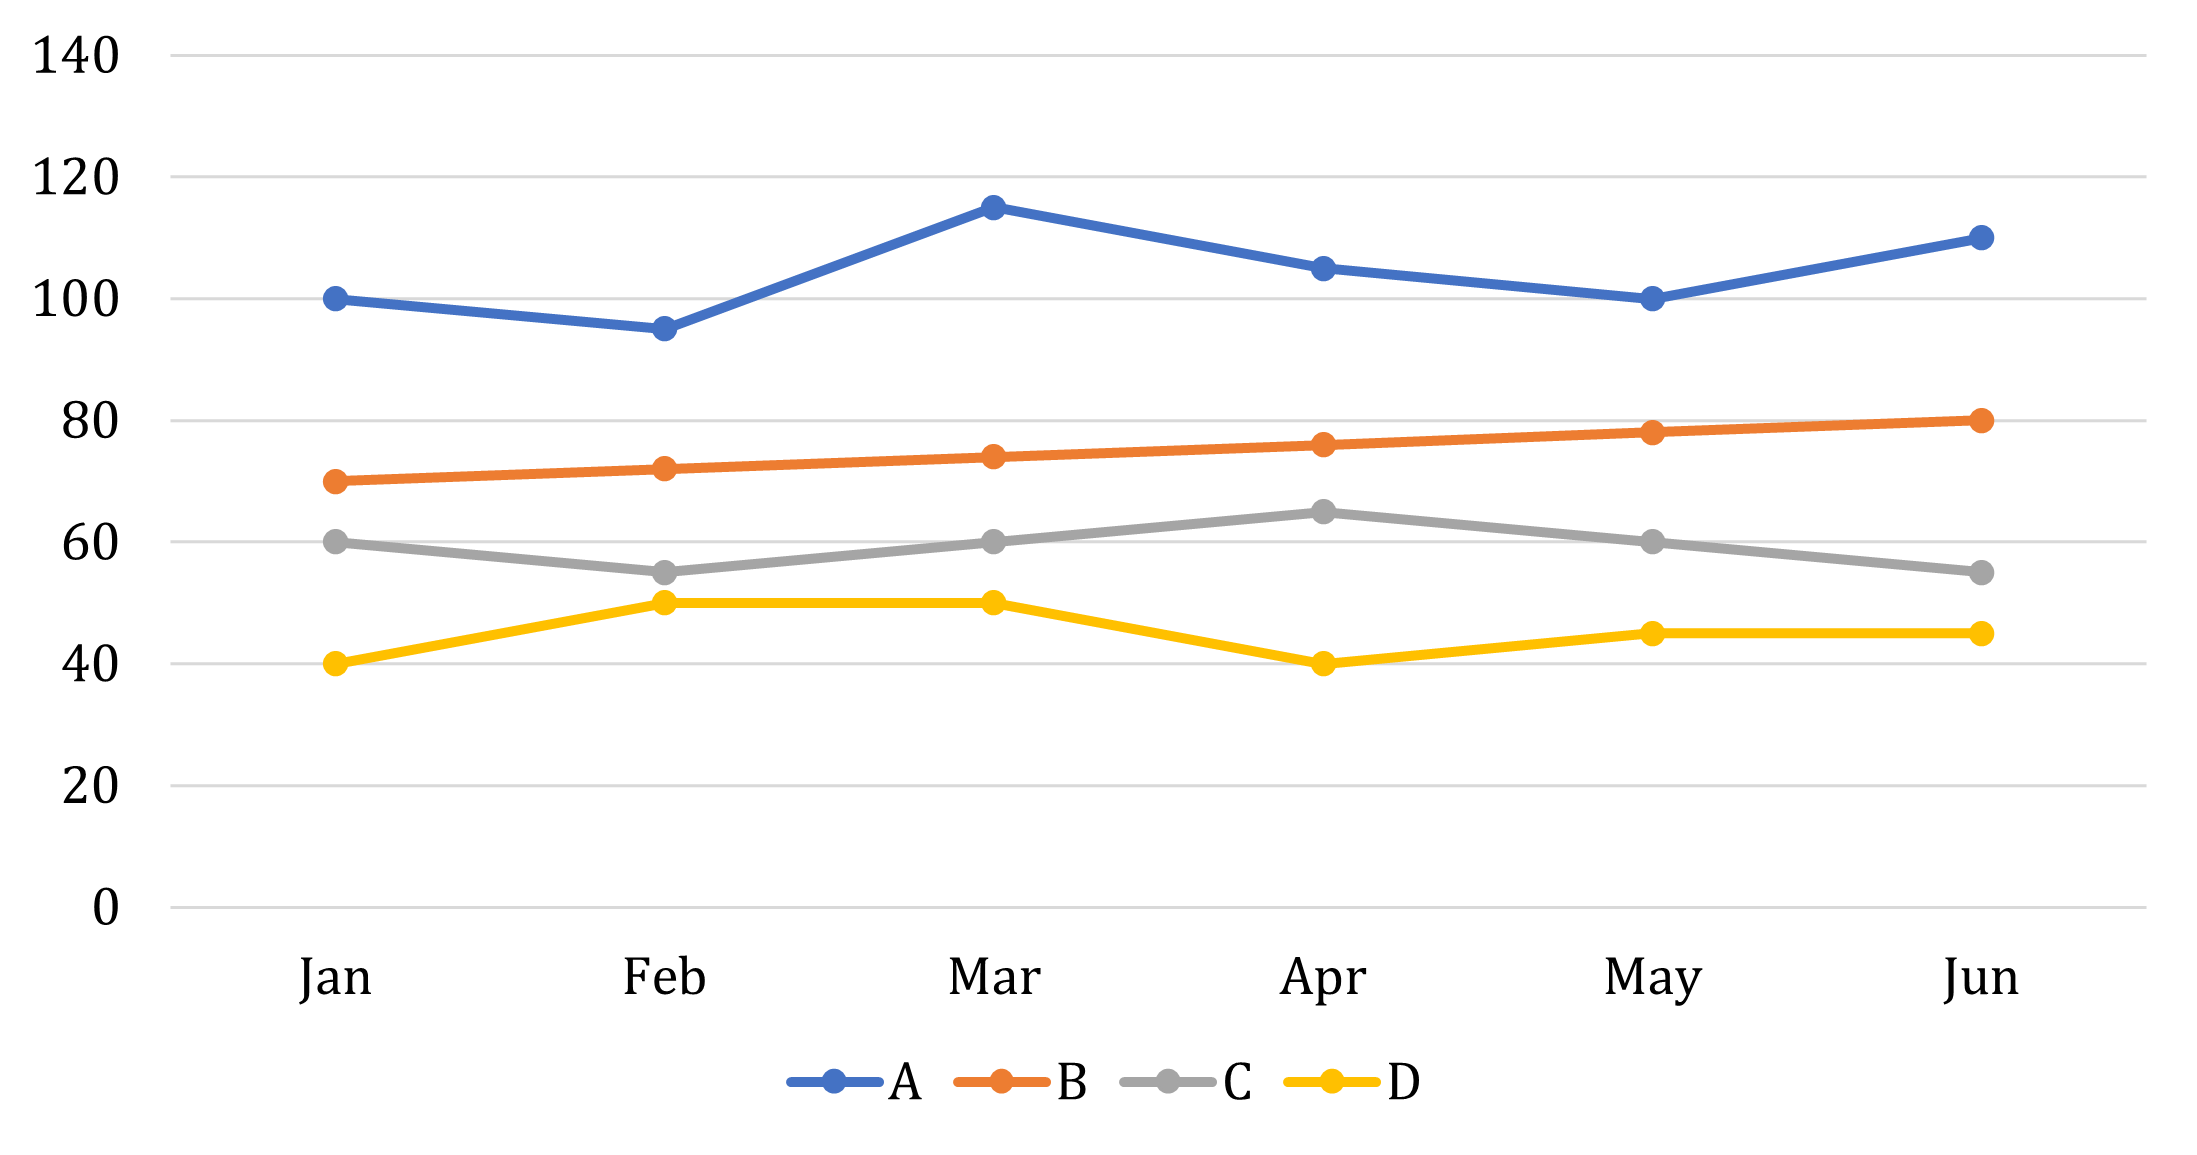
Which share showed the greatest percentage increase in market value in any month during the entire period?
The graph below shows the end of the month market values of 4 shares for the period from January to June. Answer the following questions based on this graph.
In which month was the greatest absolute change in market value for any share recorded?
The graph below shows the end of the month market values of 4 shares for the period from January to June. Answer the following questions based on this graph.
In which month was the greatest percentage increase in market value for any share recorded?
The graph below shows the end of the month market values of 4 shares for the period from January to June. Answer the following questions based on this graph.
An individual wishes to sell 1 share of C and 1 share of D to buy 1 share of A at the end of a month. At which month-end would the individual’s loss from this decision, due to share value changes, be the most?
The graph below shows the end of the month market values of 4 shares for the period from January to June. Answer the following questions based on this graph.
An individual decides to sell 1 share of C and 1 share of D to buy 1 share of A at the end of the month. What can be the individual’s greatest gain from this decision, due to share value changes?
Study the following graph and answer questions that follow. The x – axis denotes the years from 1983 to 1991.
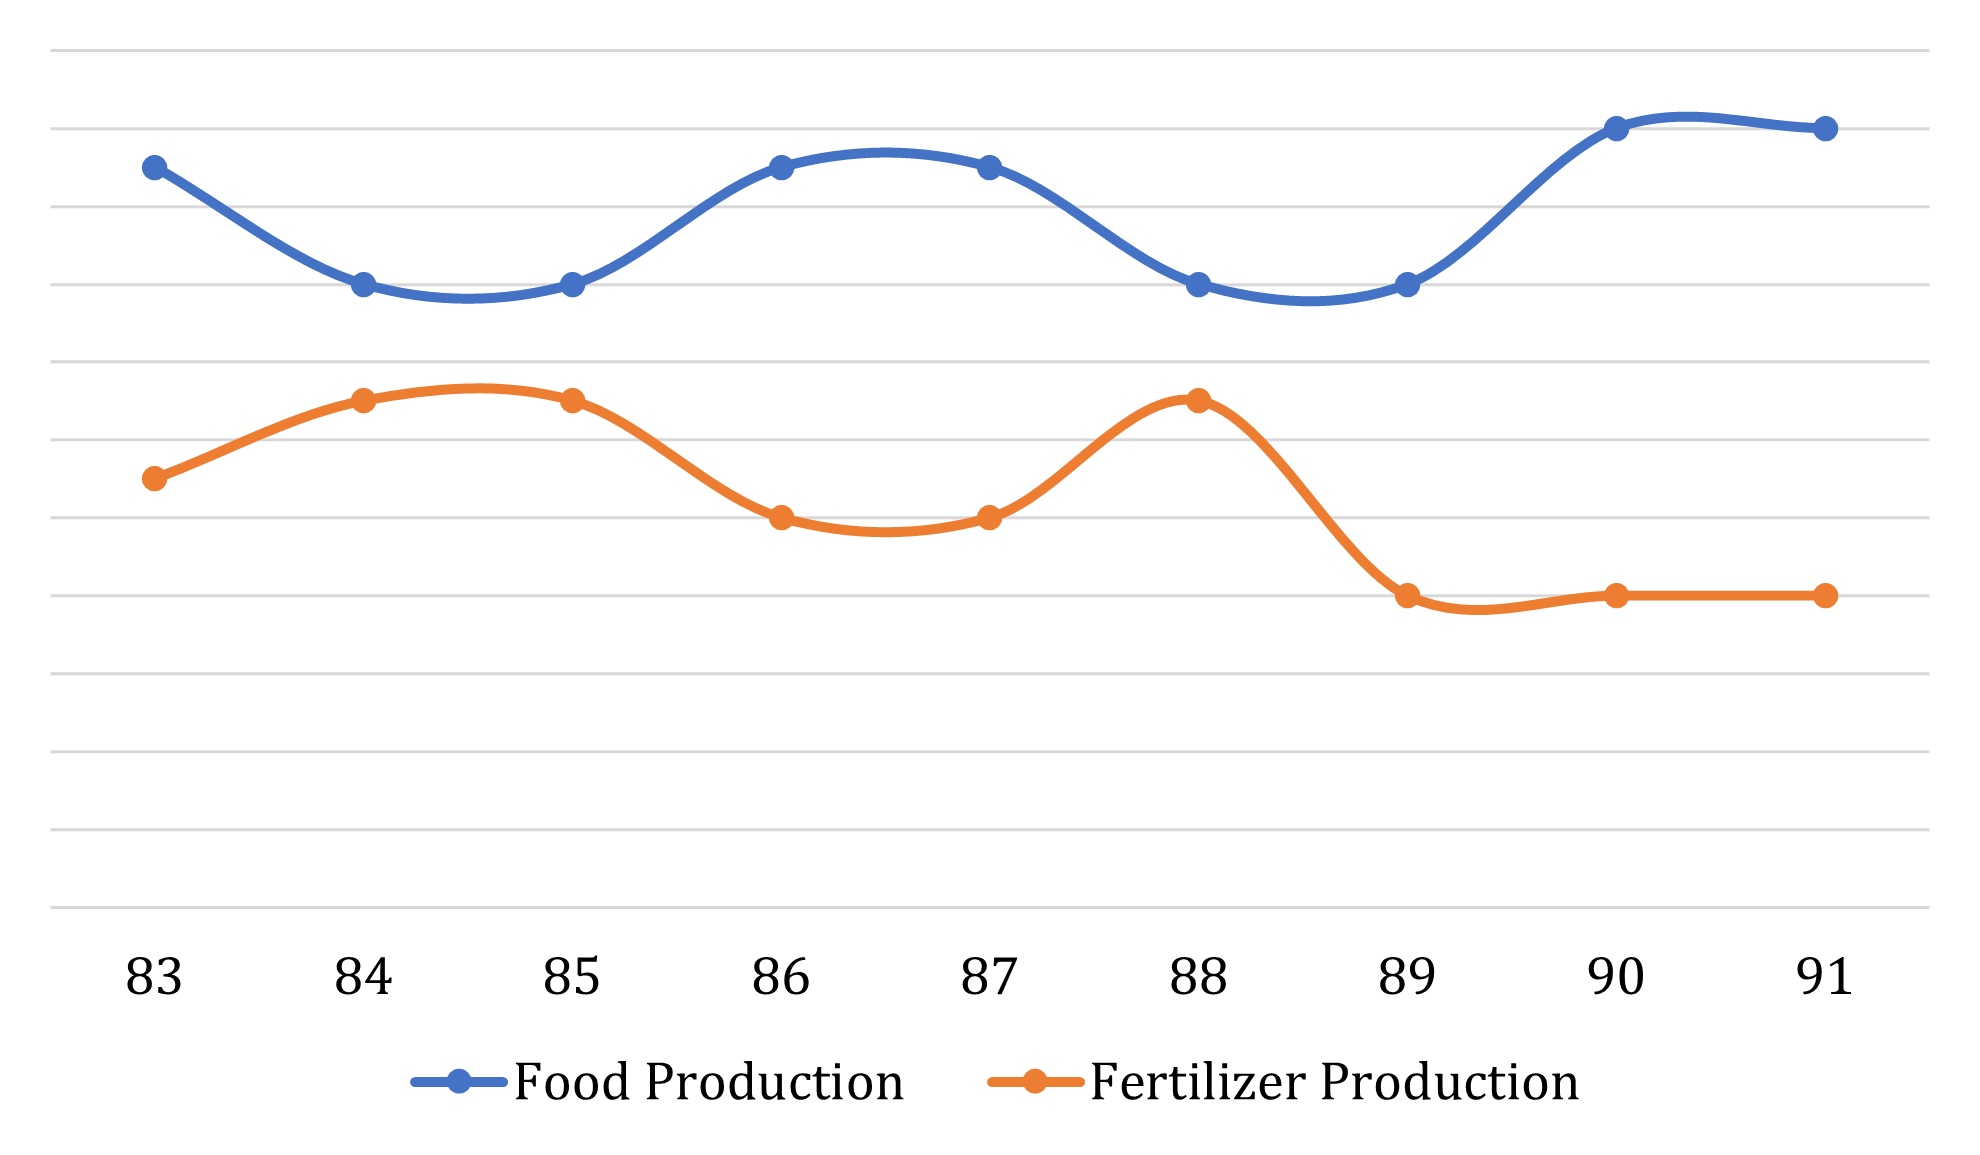
The sum of food and fertilizer production has shown a constant value for how many years?
Study the following graph and answer questions that follow. The x – axis denotes the years from 1983 to 1991.
If in 1988, the sum of the food and fertilizer production was 170 million tonnes, the value of food production must have been (approximately, in million tonnes) …
Study the following graph and answer questions that follow. The x – axis denotes the years from 1983 to 1991.
From its apparent behaviour, the food production in year 1992 can be expected to …
Study the following graph and answer questions that follow. The x – axis denotes the years from 1983 to 1991.
Going according to previous trends, one can say that the Fertilizer Production has shown an anomalous behaviour in which year?
Study the following graph and answer questions that follow. The x – axis denotes the years from 1983 to 1991.
A scholar observed that if the production of fertilizers in 1989 had been the same as that in 1988, then the total fertilizer production for all the given years would have been 450 million tonnes. Using this information, and knowing that the food production has been plotted on the same scale, one may say that the food production in 1983 was approximately, in million tonnes) …
Study the following graph and answer questions that follow. The x – axis denotes the years from 1983 to 1991.
A man starting at a point walks one km east, then two km north, then one km east, then one km north, then one km east and then one km north to arrive at the destination. What is the shortest distance from the starting point to the destination?
Study the following graph and answer questions that follow. The x – axis denotes the years from 1983 to 1991.
If 8 + 12 = 2, 7 + 14 = 3 then 10 + 18 = ?