CAT 1997 — DILR Question 25
Bar GraphsEasy
Passage / Data
Direction: Answer the questions based on the following graph.
The graph given below gives the yearly details of money invested in producing a certain product over the years 1991 to 1995. It also gives the profit (in ‘000 rupees).
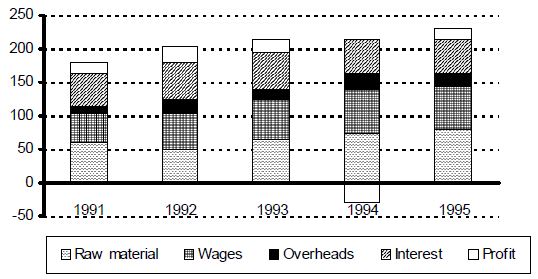
In which year were the overheads, as a percentage of the raw material, maximum?
Answer & solution
- A
1995
- B
1994
1992
- D
1993
Solution
 ââââââââââââââ
Thus, it can be seen from the above table that the overheads as a percentage of raw material is maximum for 1992.