CAT 1997 — DILR Question 26
Bar GraphsEasy
Passage / Data
Direction: Answer the questions based on the following graph.
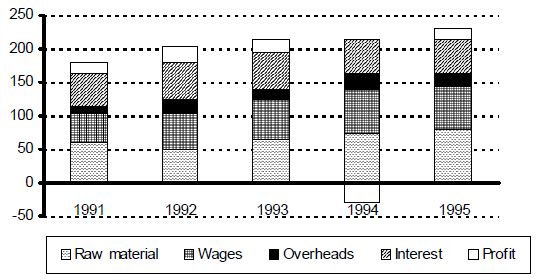
The graph given below gives the yearly details of money invested in producing a certain product over the years 1991 to 1995. It also gives the profit (in ‘000 rupees).
What percentage of the costs did the profits form over the period?
Answer & solution
Correct answer: 5%
- A
3%
5%
- C
8%
- D
11%
Solution
The total profits over the period
= (15 + 25 + 20 – 30 + 15) = 45
Total costs
= (330 + 290 + 90 + 260) = 970
Hence, profit/costs = 4.6% = 5% (Approximately)
Related Bar Graphs questions
- When was the per capita production of milk least?…
- When was the per capita production of foodgrains most?…
- In which year was the difference between the percentage increase in the producti…
- If milk contains 320 calories and foodgrains contain 160 calories, in which year…
- If one gallon milk contains 120 g of a particular nutrient and one tonne of food…
- Referring to the above question, in which year was the per capita consumption of…