CAT 1997 — DILR Question 27
Bar GraphsEasy
Passage / Data
Direction: Answer the questions based on the following graph.
The graph given below gives the yearly details of money invested in producing a certain product over the years 1991 to 1995. It also gives the profit (in ‘000 rupees).
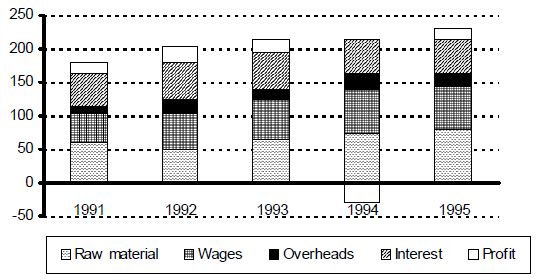
If the interest component is not included in the total cost calculation, which year would show the maximum profit per unit cost?
Answer & solution
Correct answer: 1992
- A
1991
1992
- C
1993
- D
1995
Solution
If the interest component is not included in the cost, the data can be represented as follows.
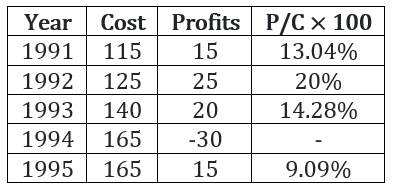
Hence, we can see from the table that maximum profit per unit cost is in 1992.
Related Bar Graphs questions
- When was the per capita production of milk least?…
- When was the per capita production of foodgrains most?…
- In which year was the difference between the percentage increase in the producti…
- If milk contains 320 calories and foodgrains contain 160 calories, in which year…
- If one gallon milk contains 120 g of a particular nutrient and one tonne of food…
- Referring to the above question, in which year was the per capita consumption of…