CAT 1999 — DILR Question 27
Bar GraphsEasy
Passage / Data
Directions: Answer the questions based on the following information.
The figure below represents sales and net profit in Rs. crore of IVP Ltd. for five years from 1994-95 to 1998-99. During this period the sales increased from Rs. 100 crore to Rs. 680 crore. Correspondingly, the net profit increased from Rs. 2.5 crore to Rs. 12 crore. Net profit is defined as the excess of sales over total costs.
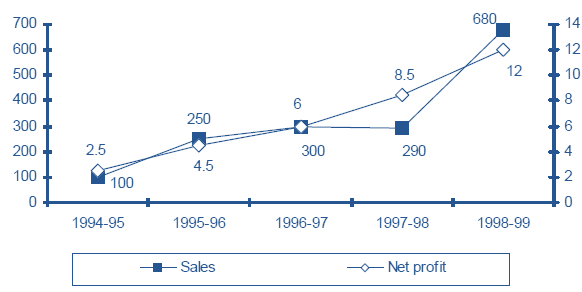
Defining profitability as the ratio of net profit to sales, IVP Ltd., recorded the highest profitability in
Answer & solution
Correct answer: 1997-98
- A
1998-99
1997-98
- C
1994-95
- D
1996-97
Solution
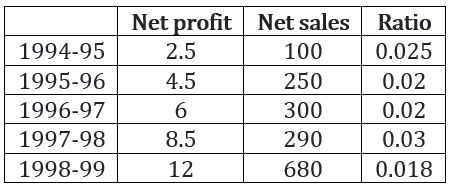
The profitability is maximum for 1997-98.
Related Bar Graphs questions
- The highest percentage of growth in sales, relative to the previous year, occurr…
- The highest percentage growth in net profit, relative to the previous year, was …
- With profitability as defined in question 137, it can be concluded that…
- Price change of a commodity is defined as the absolute difference in ending and …
- Price volatility (PV) of a commodity is defined as follows: PV = (Highest price …
- Mr X, a fund manager with an investment company invested 25% of his funds in eac…