CAT 1999 — DILR Question 28
Directions: Answer the questions based on the following information.
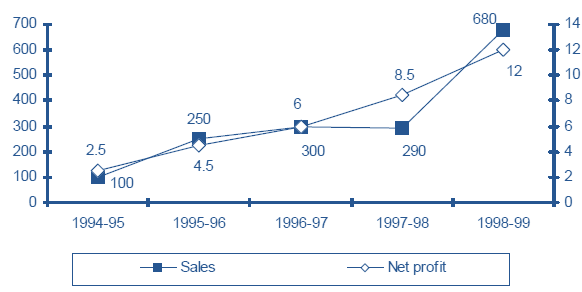
The figure below represents sales and net profit in Rs. crore of IVP Ltd. for five years from 1994-95 to 1998-99. During this period the sales increased from Rs. 100 crore to Rs. 680 crore. Correspondingly, the net profit increased from Rs. 2.5 crore to Rs. 12 crore. Net profit is defined as the excess of sales over total costs.
With profitability as defined in question 137, it can be concluded that
Answer & solution
- A
profitability is non-decreasing during the five years from 1994-95 to 1998-99.
- B
profitability is non-increasing during the five years from 1994-95 to 1998-99.
- C
profitability remained constant during the five years from 1994-95 to 1998-99.
None of the above
It may be seen that profitability does not follow a fixed pattern as the first three statements try to generalize the profitability. They are not applicable.