CAT 2004 — DILR Question 9
Answer the following question based on the information given below.
The data points in the figure below represent monthly income and expenditure data of individual members of the Ahuja family , the Bose family , the Coomar family , and the Dubey family . For these questions, savings is defined as
Savings = Income − Expenditure

Which family has the highest average expenditure?
Answer & solution
- A
Ahuja
- B
Bose
- C
Coomar
Dubey
All these questions can be solved by mere observation.
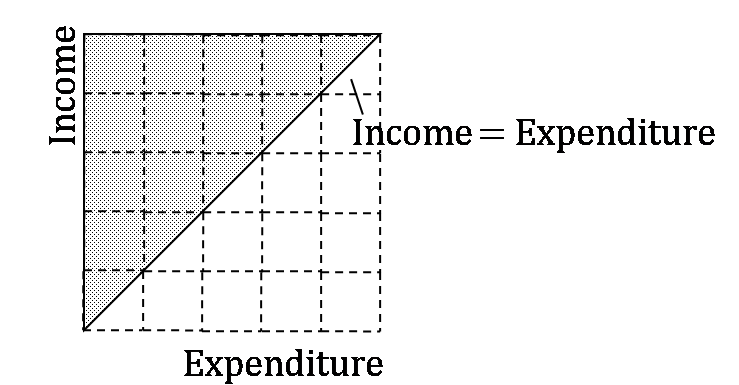
The shaded portion of the graph is the region where Income > Expenditure and the unshaded portion is where Expenditure > Income.
By observation we can see that the average expenditure of the Dubey family is approximately 2000. The average expenditures of the Ahuja family, the Bose family and the Coomar family are definitely lesser than this.
Hence, option (d).