CAT 2004 — DILR
All 32 DILR questions from CAT 2004, with the answer key and detailed solutions. Practise free — check answers as you go, or tap Show solution.
CAT 2004 · DILR
Answer the following question based on the information given below.
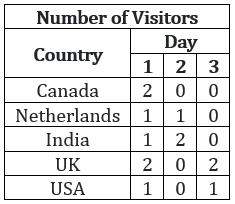
Prof. Singh has been tracking the number of visitors to his homepage. His service provider has provided him with the following data on the country of origin of the visitors and the university they belong to:
 âââââââ
 âââââââ
University 1 can belong to ______.
Answer the following question based on the information given below.
Prof. Singh has been tracking the number of visitors to his homepage. His service provider has provided him with the following data on the country of origin of the visitors and the university they belong to:
âââââââ
âââââââ
To which country does University 5 belong?
Answer the following question based on the information given below.
Prof. Singh has been tracking the number of visitors to his homepage. His service provider has provided him with the following data on the country of origin of the visitors and the university they belong to:
âââââââ
âââââââ
Visitors from how many universities from UK visited Prof. Singh’s homepage in the three days?
Answer the following question based on the information given below.
Prof. Singh has been tracking the number of visitors to his homepage. His service provider has provided him with the following data on the country of origin of the visitors and the university they belong to:
âââââââ
âââââââ
Which among the listed countries can possibly host three of the eight listed universities?
Answer the following question based on the information given below.
A study was conducted to ascertain the relative importance that employees in five different countries assigned to five different traits in their Chief Executive Officers. The traits were compassion (C), decisiveness (D), negotiation skills (N), public visibility (P), and vision (V). The level of dissimilarity between two countries is the maximum difference in the ranks allotted by the two countries to any of the five traits. The following table indicates the rank order of the five traits for each country.
 âââââââ
Three of the following four pairs of countries have identical levels of dissimilarity. Which pair is the odd one out?
Answer the following question based on the information given below.
A study was conducted to ascertain the relative importance that employees in five different countries assigned to five different traits in their Chief Executive Officers. The traits were compassion (C), decisiveness (D), negotiation skills (N), public visibility (P), and vision (V). The level of dissimilarity between two countries is the maximum difference in the ranks allotted by the two countries to any of the five traits. The following table indicates the rank order of the five traits for each country.
âââââââ
Which amongst the following countries is most dissimilar to India?
Answer the following question based on the information given below.
A study was conducted to ascertain the relative importance that employees in five different countries assigned to five different traits in their Chief Executive Officers. The traits were compassion (C), decisiveness (D), negotiation skills (N), public visibility (P), and vision (V). The level of dissimilarity between two countries is the maximum difference in the ranks allotted by the two countries to any of the five traits. The following table indicates the rank order of the five traits for each country.
âââââââ
Which of the following countries is least dissimilar to India?
Answer the following question based on the information given below.
A study was conducted to ascertain the relative importance that employees in five different countries assigned to five different traits in their Chief Executive Officers. The traits were compassion (C), decisiveness (D), negotiation skills (N), public visibility (P), and vision (V). The level of dissimilarity between two countries is the maximum difference in the ranks allotted by the two countries to any of the five traits. The following table indicates the rank order of the five traits for each country.
âââââââ
Which of the following pairs of countries are most dissimilar?
Answer the following question based on the information given below.
The data points in the figure below represent monthly income and expenditure data of individual members of the Ahuja family , the Bose family , the Coomar family , and the Dubey family . For these questions, savings is defined as
Savings = Income − Expenditure

Which family has the highest average expenditure?
Answer the following question based on the information given below.
The data points in the figure below represent monthly income and expenditure data of individual members of the Ahuja family , the Bose family , the Coomar family , and the Dubey family . For these questions, savings is defined as
Savings = Income − Expenditure
Which family has the lowest average income?
Answer the following question based on the information given below.
The data points in the figure below represent monthly income and expenditure data of individual members of the Ahuja family , the Bose family , the Coomar family , and the Dubey family . For these questions, savings is defined as
Savings = Income − Expenditure
The highest amount of savings accrues to a member of which family?
Answer the following question based on the information given below.
The data points in the figure below represent monthly income and expenditure data of individual members of the Ahuja family , the Bose family , the Coomar family , and the Dubey family . For these questions, savings is defined as
Savings = Income − Expenditure
Which family has the lowest average savings?
Answer the following question based on the information given below.
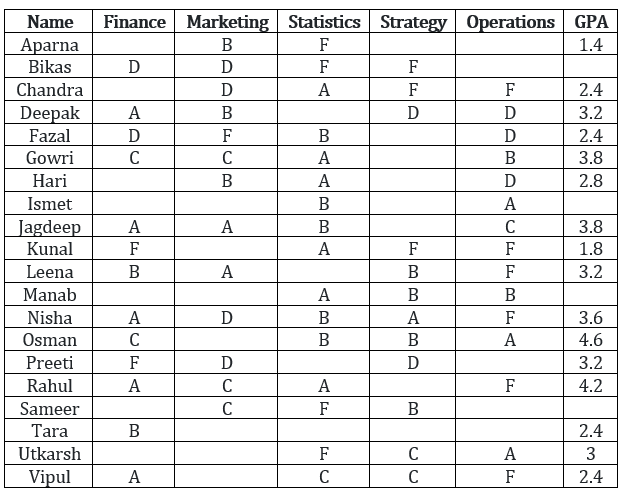
The Dean’s office recently scanned student results into the central computer system. When their character reading software cannot read something, it leaves the space blank. The scanner output reads as follows:
 âââââââ
In the grading system, A, B, C, D, and F grades fetch 6, 4, 3, 2, and 0 grade points respectively. The Grade Point Average (GPA) is the arithmetic mean of the grade points obtained in the five subjects.
For example Nisha's GPA is 3.6
Some additional facts are also known about the students’ grades. These are:
a. Vipul obtained the same grade in Marketing as Aparna obtained in Finance and Strategy.
b. Fazal obtained the same grade in Strategy as Utkarsh did in Marketing.
c. Tara received the same grade in exactly three courses.
In Operations, Tara could have received the same grade as ____________.
Answer the following question based on the information given below.
The Dean’s office recently scanned student results into the central computer system. When their character reading software cannot read something, it leaves the space blank. The scanner output reads as follows:
âââââââ
In the grading system, A, B, C, D, and F grades fetch 6, 4, 3, 2, and 0 grade points respectively. The Grade Point Average (GPA) is the arithmetic mean of the grade points obtained in the five subjects.
For example Nisha's GPA is 3.6
Some additional facts are also known about the students’ grades. These are:
a. Vipul obtained the same grade in Marketing as Aparna obtained in Finance and Strategy.
b. Fazal obtained the same grade in Strategy as Utkarsh did in Marketing.
c. Tara received the same grade in exactly three courses.
What grade did Preeti obtain in Statistics?
Answer the following question based on the information given below.
The Dean’s office recently scanned student results into the central computer system. When their character reading software cannot read something, it leaves the space blank. The scanner output reads as follows:
âââââââ
In the grading system, A, B, C, D, and F grades fetch 6, 4, 3, 2, and 0 grade points respectively. The Grade Point Average (GPA) is the arithmetic mean of the grade points obtained in the five subjects.
For example Nisha's GPA is 3.6
Some additional facts are also known about the students’ grades. These are:
a. Vipul obtained the same grade in Marketing as Aparna obtained in Finance and Strategy.
b. Fazal obtained the same grade in Strategy as Utkarsh did in Marketing.
c. Tara received the same grade in exactly three courses.
What grade did Utkarsh obtain in Finance?
Answer the following question based on the information given below.
The Dean’s office recently scanned student results into the central computer system. When their character reading software cannot read something, it leaves the space blank. The scanner output reads as follows:
âââââââ
In the grading system, A, B, C, D, and F grades fetch 6, 4, 3, 2, and 0 grade points respectively. The Grade Point Average (GPA) is the arithmetic mean of the grade points obtained in the five subjects.
For example Nisha's GPA is 3.6
Some additional facts are also known about the students’ grades. These are:
a. Vipul obtained the same grade in Marketing as Aparna obtained in Finance and Strategy.
b. Fazal obtained the same grade in Strategy as Utkarsh did in Marketing.
c. Tara received the same grade in exactly three courses.
In Strategy, Gowri’s grade point was higher than that obtained by _________.
Answer the following question based on the information given below.
Purana and Naya are two brands of kitchen mixer-grinders available in the local market. Purana is an old brand that was introduced in 1990, while Naya was introduced in 1997. For both these brands, 20% of the mixer-grinders bought in a particular year are disposed off as junk exactly two years later. It is known that 10 Purana mixer-grinders were disposed off in 1997. The following figures show the number of Purana and Naya mixer-grinders in operation from 1995 to 2000, as at the end of the year.

How many Naya mixer-grinders were disposed of by the end of 2000?
Answer the following question based on the information given below.
Purana and Naya are two brands of kitchen mixer-grinders available in the local market. Purana is an old brand that was introduced in 1990, while Naya was introduced in 1997. For both these brands, 20% of the mixer-grinders bought in a particular year are disposed off as junk exactly two years later. It is known that 10 Purana mixer-grinders were disposed off in 1997. The following figures show the number of Purana and Naya mixer-grinders in operation from 1995 to 2000, as at the end of the year.
How many Naya mixer-grinders were purchased in 1999?
Answer the following question based on the information given below.
Purana and Naya are two brands of kitchen mixer-grinders available in the local market. Purana is an old brand that was introduced in 1990, while Naya was introduced in 1997. For both these brands, 20% of the mixer-grinders bought in a particular year are disposed off as junk exactly two years later. It is known that 10 Purana mixer-grinders were disposed off in 1997. The following figures show the number of Purana and Naya mixer-grinders in operation from 1995 to 2000, as at the end of the year.
How many Purana mixer-grinders were purchased in 1999?
Answer the following question based on the information given below.
Purana and Naya are two brands of kitchen mixer-grinders available in the local market. Purana is an old brand that was introduced in 1990, while Naya was introduced in 1997. For both these brands, 20% of the mixer-grinders bought in a particular year are disposed off as junk exactly two years later. It is known that 10 Purana mixer-grinders were disposed off in 1997. The following figures show the number of Purana and Naya mixer-grinders in operation from 1995 to 2000, as at the end of the year.
How many Purana mixer-grinders were disposed of in 2000?
Answer the following question based on the information given below.
Coach John sat with the score cards of Indian players from the 3 games in a one-day cricket tournament where the same set of players played for India and all the major batsmen got out. John summarized the batting performance through three diagrams, one for each game. In each diagram, the three outer triangles communicate the number of runs scored by the three top scorers from India, where K, R, S, V, and Y represent Kaif, Rahul, Saurav, Virender, and Yuvraj respectively. The middle triangle in each diagram denotes the percentage of total score that was scored by the top three Indian scorers in that game. No two players score the same number of runs in the same game. John also calculated two batting indices for each player based on his scores in the tournament; the R-index of a batsman is the difference between his highest and lowest scores in the 3 games while the M-index is the middle number, if his scores are arranged in a non-increasing order

Which of the players had the best M-index from the tournament?
Answer the following question based on the information given below.
Coach John sat with the score cards of Indian players from the 3 games in a one-day cricket tournament where the same set of players played for India and all the major batsmen got out. John summarized the batting performance through three diagrams, one for each game. In each diagram, the three outer triangles communicate the number of runs scored by the three top scorers from India, where K, R, S, V, and Y represent Kaif, Rahul, Saurav, Virender, and Yuvraj respectively. The middle triangle in each diagram denotes the percentage of total score that was scored by the top three Indian scorers in that game. No two players score the same number of runs in the same game. John also calculated two batting indices for each player based on his scores in the tournament; the R-index of a batsman is the difference between his highest and lowest scores in the 3 games while the M-index is the middle number, if his scores are arranged in a non-increasing order
Among the players mentioned, who can have the lowest R-index from the tournament?
Answer the following question based on the information given below.
Coach John sat with the score cards of Indian players from the 3 games in a one-day cricket tournament where the same set of players played for India and all the major batsmen got out. John summarized the batting performance through three diagrams, one for each game. In each diagram, the three outer triangles communicate the number of runs scored by the three top scorers from India, where K, R, S, V, and Y represent Kaif, Rahul, Saurav, Virender, and Yuvraj respectively. The middle triangle in each diagram denotes the percentage of total score that was scored by the top three Indian scorers in that game. No two players score the same number of runs in the same game. John also calculated two batting indices for each player based on his scores in the tournament; the R-index of a batsman is the difference between his highest and lowest scores in the 3 games while the M-index is the middle number, if his scores are arranged in a non-increasing order
For how many Indian players is it possible to calculate the exact M-index?
Answer the following question based on the information given below.
Coach John sat with the score cards of Indian players from the 3 games in a one-day cricket tournament where the same set of players played for India and all the major batsmen got out. John summarized the batting performance through three diagrams, one for each game. In each diagram, the three outer triangles communicate the number of runs scored by the three top scorers from India, where K, R, S, V, and Y represent Kaif, Rahul, Saurav, Virender, and Yuvraj respectively. The middle triangle in each diagram denotes the percentage of total score that was scored by the top three Indian scorers in that game. No two players score the same number of runs in the same game. John also calculated two batting indices for each player based on his scores in the tournament; the R-index of a batsman is the difference between his highest and lowest scores in the 3 games while the M-index is the middle number, if his scores are arranged in a non-increasing order
How many players among those listed definitely scored less than Yuvraj in the tournament?
Answer the following question based on the information given below.
Twenty one participants from four continents (Africa, Americas, Australasia, and Europe) attended a United Nations conference. Each participant was an expert in one of four fields, labour, health, population studies, and refugee relocation. The following five facts about the participants are given.
a. The number of labour experts in the camp was exactly half the number of experts in each of the three other categories.
b. Africa did not send any labour expert. Otherwise, every continent, including Africa, sent at least one expert for each category.
c. None of the continents sent more than three experts in any category.
d. If there had been one less Australasian expert, then the Americas would have had twice as many experts as each of the other continents.
e. Mike and Alfanso are leading experts of population studies who attended the conference. They are from Australasia.
Which of the following numbers cannot be determined from the information given?
Answer the following question based on the information given below.
Twenty one participants from four continents (Africa, Americas, Australasia, and Europe) attended a United Nations conference. Each participant was an expert in one of four fields, labour, health, population studies, and refugee relocation. The following five facts about the participants are given.
a. The number of labour experts in the camp was exactly half the number of experts in each of the three other categories.
b. Africa did not send any labour expert. Otherwise, every continent, including Africa, sent at least one expert for each category.
c. None of the continents sent more than three experts in any category.
d. If there had been one less Australasian expert, then the Americas would have had twice as many experts as each of the other continents.
e. Mike and Alfanso are leading experts of population studies who attended the conference. They are from Australasia.
Which of the following combinations is NOT possible?
Answer the following question based on the information given below.
Twenty one participants from four continents (Africa, Americas, Australasia, and Europe) attended a United Nations conference. Each participant was an expert in one of four fields, labour, health, population studies, and refugee relocation. The following five facts about the participants are given.
a. The number of labour experts in the camp was exactly half the number of experts in each of the three other categories.
b. Africa did not send any labour expert. Otherwise, every continent, including Africa, sent at least one expert for each category.
c. None of the continents sent more than three experts in any category.
d. If there had been one less Australasian expert, then the Americas would have had twice as many experts as each of the other continents.
e. Mike and Alfanso are leading experts of population studies who attended the conference. They are from Australasia.
If Ramos is the lone American expert in population studies, which of the following is NOT true about the numbers of experts in the conference from the four continents?
Answer the following question based on the information given below.
Twenty one participants from four continents (Africa, Americas, Australasia, and Europe) attended a United Nations conference. Each participant was an expert in one of four fields, labour, health, population studies, and refugee relocation. The following five facts about the participants are given.
a. The number of labour experts in the camp was exactly half the number of experts in each of the three other categories.
b. Africa did not send any labour expert. Otherwise, every continent, including Africa, sent at least one expert for each category.
c. None of the continents sent more than three experts in any category.
d. If there had been one less Australasian expert, then the Americas would have had twice as many experts as each of the other continents.
e. Mike and Alfanso are leading experts of population studies who attended the conference. They are from Australasia.
Alex, an American expert in refugee relocation, was the first keynote speaker in the conference. What can be inferred about the number of American experts in refugee relocation in the conference, excluding Alex?
i. At least one
ii. At most two
Answer the following question based on the information given below.
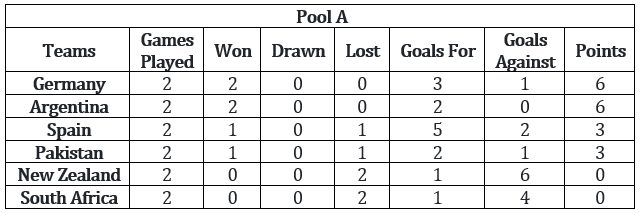
The year was 2006. All six teams in Pool A of World Cup hockey, play each other exactly once. Each win earns a team three points, a draw earns one point and a loss earns zero points. The two teams with the highest points qualify for the semi-finals. In case of a tie, the team with the highest goal difference (Goal For – Goals Against) qualifies.
 âââââââ
In the opening match, Spain lost to Germany. After the second round (after each team played two matches), the pool table looked as shown below.
In the third round, Spain played Pakistan, Argentina played Germany, and New Zealand played South Africa. All the third round matches were drawn. The following are some results from the fourth and fifth round matches.
a. Spain won both the fourth and fifth round matches.
b. Both Argentina and Germany won their fifth round matches by 3 goals to 0.
c. Pakistan won both the fourth and fifth round matches by 1 goal to 0.
Which one of the following statements is true about matches played in the first two rounds?
Answer the following question based on the information given below.
The year was 2006. All six teams in Pool A of World Cup hockey, play each other exactly once. Each win earns a team three points, a draw earns one point and a loss earns zero points. The two teams with the highest points qualify for the semi-finals. In case of a tie, the team with the highest goal difference (Goal For – Goals Against) qualifies.
âââââââ
In the opening match, Spain lost to Germany. After the second round (after each team played two matches), the pool table looked as shown below.
In the third round, Spain played Pakistan, Argentina played Germany, and New Zealand played South Africa. All the third round matches were drawn. The following are some results from the fourth and fifth round matches.
a. Spain won both the fourth and fifth round matches.
b. Both Argentina and Germany won their fifth round matches by 3 goals to 0.
c. Pakistan won both the fourth and fifth round matches by 1 goal to 0.
If Pakistan qualified as one of the two teams from Pool A, which was the other team that qualified?
Answer the following question based on the information given below.
The year was 2006. All six teams in Pool A of World Cup hockey, play each other exactly once. Each win earns a team three points, a draw earns one point and a loss earns zero points. The two teams with the highest points qualify for the semi-finals. In case of a tie, the team with the highest goal difference (Goal For – Goals Against) qualifies.
âââââââ
In the opening match, Spain lost to Germany. After the second round (after each team played two matches), the pool table looked as shown below.
In the third round, Spain played Pakistan, Argentina played Germany, and New Zealand played South Africa. All the third round matches were drawn. The following are some results from the fourth and fifth round matches.
a. Spain won both the fourth and fifth round matches.
b. Both Argentina and Germany won their fifth round matches by 3 goals to 0.
c. Pakistan won both the fourth and fifth round matches by 1 goal to 0.
Which team finished at the top of the pool after five rounds of matches?