Tables & Graphs — CAT Previous-Year Questions
475 previous-year questions on Tables & Graphs from CAT, with full solutions. Practise free — check answers as you go; sign in to save your progress.
Tables & Graphs · CAT PYQs
Answer the following questions based on the information given.
The chart below shows the price data for seven shares – A, B, C, D, E, F, and G as a candlestick plot for a particular day. The vertical axis shows the price of the share in rupees. A share whose closing price (price at the end of the day) is more than its opening price (price at the start of the day) is called a bullish share; otherwise, it is called a bearish share. All bullish and bearish shares are shown in green and red colour respectively.

Reading the candles against the gridlines (each gridline = ₹200), the open / close / high / low values are approximately:
| Share | Open | Close | High | Low | Type |
|---|---|---|---|---|---|
| A | 2100 | 1900 | 2400 | 1500 | Bearish (red) |
| B | 2000 | 1750 | 2050 | 1300 | Bearish (red) |
| C | 850 | 1350 | 1400 | 750 | Bullish (green) |
| D | 600 | 1050 | 1150 | 300 | Bullish (green) |
| E | 1300 | 1150 | 1450 | 1100 | Bearish (red) |
| F | 1900 | 1700 | 2150 | 1650 | Bearish (red) |
| G | 1300 | 1750 | 1800 | 1250 | Bullish (green) |
For a red (bearish) candle the body top is the opening and the body bottom is the closing; for a green (bullish) candle the body bottom is the opening and the body top is the closing. The thin wicks mark the day’s high and low.
Daily Share Price Variability (SPV) is defined as (Day’s high price - Day’s low price) / (Average of the opening and closing prices during the day). Which among the shares A, C, D and F had the highest SPV on that day?
Answer the following questions based on the information given.
The chart below shows the price data for seven shares – A, B, C, D, E, F, and G as a candlestick plot for a particular day. The vertical axis shows the price of the share in rupees. A share whose closing price (price at the end of the day) is more than its opening price (price at the start of the day) is called a bullish share; otherwise, it is called a bearish share. All bullish and bearish shares are shown in green and red colour respectively.
Reading the candles against the gridlines (each gridline = ₹200), the open / close / high / low values are approximately:
| Share | Open | Close | High | Low | Type |
|---|---|---|---|---|---|
| A | 2100 | 1900 | 2400 | 1500 | Bearish (red) |
| B | 2000 | 1750 | 2050 | 1300 | Bearish (red) |
| C | 850 | 1350 | 1400 | 750 | Bullish (green) |
| D | 600 | 1050 | 1150 | 300 | Bullish (green) |
| E | 1300 | 1150 | 1450 | 1100 | Bearish (red) |
| F | 1900 | 1700 | 2150 | 1650 | Bearish (red) |
| G | 1300 | 1750 | 1800 | 1250 | Bullish (green) |
For a red (bearish) candle the body top is the opening and the body bottom is the closing; for a green (bullish) candle the body bottom is the opening and the body top is the closing. The thin wicks mark the day’s high and low.
Daily Share Price Variability (SPV) is defined as (Day’s high price - Day’s low price) / (Average of the opening and closing prices during the day). How many shares had an SPV greater than 0.5 on that day?
Answer the following questions based on the information given.
The chart below shows the price data for seven shares – A, B, C, D, E, F, and G as a candlestick plot for a particular day. The vertical axis shows the price of the share in rupees. A share whose closing price (price at the end of the day) is more than its opening price (price at the start of the day) is called a bullish share; otherwise, it is called a bearish share. All bullish and bearish shares are shown in green and red colour respectively.
Reading the candles against the gridlines (each gridline = ₹200), the open / close / high / low values are approximately:
| Share | Open | Close | High | Low | Type |
|---|---|---|---|---|---|
| A | 2100 | 1900 | 2400 | 1500 | Bearish (red) |
| B | 2000 | 1750 | 2050 | 1300 | Bearish (red) |
| C | 850 | 1350 | 1400 | 750 | Bullish (green) |
| D | 600 | 1050 | 1150 | 300 | Bullish (green) |
| E | 1300 | 1150 | 1450 | 1100 | Bearish (red) |
| F | 1900 | 1700 | 2150 | 1650 | Bearish (red) |
| G | 1300 | 1750 | 1800 | 1250 | Bullish (green) |
For a red (bearish) candle the body top is the opening and the body bottom is the closing; for a green (bullish) candle the body bottom is the opening and the body top is the closing. The thin wicks mark the day’s high and low.
Daily loss for a share is defined as (Opening price – Closing price) / (Opening price). Which among the shares A, B, F and G had the highest daily loss on that day?
Answer the following questions based on the information given.
The chart below shows the price data for seven shares – A, B, C, D, E, F, and G as a candlestick plot for a particular day. The vertical axis shows the price of the share in rupees. A share whose closing price (price at the end of the day) is more than its opening price (price at the start of the day) is called a bullish share; otherwise, it is called a bearish share. All bullish and bearish shares are shown in green and red colour respectively.
Reading the candles against the gridlines (each gridline = ₹200), the open / close / high / low values are approximately:
| Share | Open | Close | High | Low | Type |
|---|---|---|---|---|---|
| A | 2100 | 1900 | 2400 | 1500 | Bearish (red) |
| B | 2000 | 1750 | 2050 | 1300 | Bearish (red) |
| C | 850 | 1350 | 1400 | 750 | Bullish (green) |
| D | 600 | 1050 | 1150 | 300 | Bullish (green) |
| E | 1300 | 1150 | 1450 | 1100 | Bearish (red) |
| F | 1900 | 1700 | 2150 | 1650 | Bearish (red) |
| G | 1300 | 1750 | 1800 | 1250 | Bullish (green) |
For a red (bearish) candle the body top is the opening and the body bottom is the closing; for a green (bullish) candle the body bottom is the opening and the body top is the closing. The thin wicks mark the day’s high and low.
What would have been the percentage wealth gain for a trader, who bought equal numbers of all bullish shares at opening price and sold them at their day’s high?
Answer the following questions based on the information given below.
The two plots below give the following information about six firms A, B, C, D, E, and F for 2019 and 2023.
PAT: The firm’s profits after taxes in Rs. crores,
ES: The firm’s employee strength, that is the number of employees in the firm, and
PRD: The percentage of the firm’s PAT that they spend on Research and Development (R&D).
In the plots, the horizontal and vertical coordinates of the point representing each firm give their ES and PAT values respectively. The PRD values of each firm are proportional to the areas around the points representing each firm. The areas are comparable between the two plots, i.e., equal areas in the two plots represent the same PRD values for the two years.


Approximate 2019 readings (ES on the horizontal axis, PAT on the vertical axis; bubble size ∝ PRD):
| Firm (2019) | ES (approx.) | PAT (approx.) | Bubble size (PRD) |
|---|---|---|---|
| A | 800 | 3000 | medium |
| B | 1000 | 2800 | medium-large |
| C | 600 | 2400 | medium |
| D | 600 | 3900 | small |
| E | 1200 | 2500 | large |
| F | 800 | 2500 | small |
Assume that the annual rate of growth in PAT over the previous year (ARG) remained constant over the years for each of the six firms. Which among the firms A, B, C, and E had the highest ARG?
Answer the following questions based on the information given below.
The two plots below give the following information about six firms A, B, C, D, E, and F for 2019 and 2023.
PAT: The firm’s profits after taxes in Rs. crores,
ES: The firm’s employee strength, that is the number of employees in the firm, and
PRD: The percentage of the firm’s PAT that they spend on Research and Development (R&D).
In the plots, the horizontal and vertical coordinates of the point representing each firm give their ES and PAT values respectively. The PRD values of each firm are proportional to the areas around the points representing each firm. The areas are comparable between the two plots, i.e., equal areas in the two plots represent the same PRD values for the two years.
Approximate 2019 readings (ES on the horizontal axis, PAT on the vertical axis; bubble size ∝ PRD):
| Firm (2019) | ES (approx.) | PAT (approx.) | Bubble size (PRD) |
|---|---|---|---|
| A | 800 | 3000 | medium |
| B | 1000 | 2800 | medium-large |
| C | 600 | 2400 | medium |
| D | 600 | 3900 | small |
| E | 1200 | 2500 | large |
| F | 800 | 2500 | small |
The ratio of the amount of money spent by Firm C on R&D in 2019 to that in 2023 is closest to
Answer the following questions based on the information given below.
The two plots below give the following information about six firms A, B, C, D, E, and F for 2019 and 2023.
PAT: The firm’s profits after taxes in Rs. crores,
ES: The firm’s employee strength, that is the number of employees in the firm, and
PRD: The percentage of the firm’s PAT that they spend on Research and Development (R&D).
In the plots, the horizontal and vertical coordinates of the point representing each firm give their ES and PAT values respectively. The PRD values of each firm are proportional to the areas around the points representing each firm. The areas are comparable between the two plots, i.e., equal areas in the two plots represent the same PRD values for the two years.
Approximate 2019 readings (ES on the horizontal axis, PAT on the vertical axis; bubble size ∝ PRD):
| Firm (2019) | ES (approx.) | PAT (approx.) | Bubble size (PRD) |
|---|---|---|---|
| A | 800 | 3000 | medium |
| B | 1000 | 2800 | medium-large |
| C | 600 | 2400 | medium |
| D | 600 | 3900 | small |
| E | 1200 | 2500 | large |
| F | 800 | 2500 | small |
Which among the firms A, C, E, and F had the maximum PAT per employee in 2023?
Answer the following questions based on the information given below.
The two plots below give the following information about six firms A, B, C, D, E, and F for 2019 and 2023.
PAT: The firm’s profits after taxes in Rs. crores,
ES: The firm’s employee strength, that is the number of employees in the firm, and
PRD: The percentage of the firm’s PAT that they spend on Research and Development (R&D).
In the plots, the horizontal and vertical coordinates of the point representing each firm give their ES and PAT values respectively. The PRD values of each firm are proportional to the areas around the points representing each firm. The areas are comparable between the two plots, i.e., equal areas in the two plots represent the same PRD values for the two years.
Approximate 2019 readings (ES on the horizontal axis, PAT on the vertical axis; bubble size ∝ PRD):
| Firm (2019) | ES (approx.) | PAT (approx.) | Bubble size (PRD) |
|---|---|---|---|
| A | 800 | 3000 | medium |
| B | 1000 | 2800 | medium-large |
| C | 600 | 2400 | medium |
| D | 600 | 3900 | small |
| E | 1200 | 2500 | large |
| F | 800 | 2500 | small |
Which among the firms C, D, E, and F had the least amount of R&D spending per employee in 2023?
Answer the following questions based on the information given below.
Over the top (OTT) subscribers of a platform are segregated into three categories: i) Kid, ii) Elder, and iii) Others. Some of the subscribers used one app and the others used multiple apps to access the platform. The figure below shows the percentage of the total number of subscribers in 2023 and 2024 who belong to the ‘Kid’ and ‘Elder’ categories.

| Category (% of total subscribers) | 2023 | 2024 |
|---|---|---|
| Kid | 15% | 20% |
| Elder | 20% | 30% |
| Others (balance) | 65% | 50% |
The following additional facts are known about the numbers of subscribers.
1. The total number of subscribers increased by 10% from 2023 to 2024.
2. In 2024, 1/2 of the subscribers from the ‘Kid’ category and 2/3 of the subscribers from the ‘Elder’ category use one app.
3. In 2023, the number of subscribers from the ‘Kid’ category who used multiple apps was the same as the number of subscribers from the ‘Elder’ category who used one app.
4. 10,000 subscribers from the ‘Kid’ category used one app and 15,000 subscribers from the ‘Elder’ category used multiple apps in 2023.
How many subscribers belonged to the ‘Others’ category in 2024?
Answer the following questions based on the information given below.
Over the top (OTT) subscribers of a platform are segregated into three categories: i) Kid, ii) Elder, and iii) Others. Some of the subscribers used one app and the others used multiple apps to access the platform. The figure below shows the percentage of the total number of subscribers in 2023 and 2024 who belong to the ‘Kid’ and ‘Elder’ categories.
| Category (% of total subscribers) | 2023 | 2024 |
|---|---|---|
| Kid | 15% | 20% |
| Elder | 20% | 30% |
| Others (balance) | 65% | 50% |
The following additional facts are known about the numbers of subscribers.
1. The total number of subscribers increased by 10% from 2023 to 2024.
2. In 2024, 1/2 of the subscribers from the ‘Kid’ category and 2/3 of the subscribers from the ‘Elder’ category use one app.
3. In 2023, the number of subscribers from the ‘Kid’ category who used multiple apps was the same as the number of subscribers from the ‘Elder’ category who used one app.
4. 10,000 subscribers from the ‘Kid’ category used one app and 15,000 subscribers from the ‘Elder’ category used multiple apps in 2023.
What percentage of subscribers in the ‘Kid’ category used multiple apps in 2023?
Answer the following questions based on the information given below.
Over the top (OTT) subscribers of a platform are segregated into three categories: i) Kid, ii) Elder, and iii) Others. Some of the subscribers used one app and the others used multiple apps to access the platform. The figure below shows the percentage of the total number of subscribers in 2023 and 2024 who belong to the ‘Kid’ and ‘Elder’ categories.
| Category (% of total subscribers) | 2023 | 2024 |
|---|---|---|
| Kid | 15% | 20% |
| Elder | 20% | 30% |
| Others (balance) | 65% | 50% |
The following additional facts are known about the numbers of subscribers.
1. The total number of subscribers increased by 10% from 2023 to 2024.
2. In 2024, 1/2 of the subscribers from the ‘Kid’ category and 2/3 of the subscribers from the ‘Elder’ category use one app.
3. In 2023, the number of subscribers from the ‘Kid’ category who used multiple apps was the same as the number of subscribers from the ‘Elder’ category who used one app.
4. 10,000 subscribers from the ‘Kid’ category used one app and 15,000 subscribers from the ‘Elder’ category used multiple apps in 2023.
What was the percentage increase in the number of subscribers in the ‘Elder’ category from 2023 to 2024?
Answer the following questions based on the information given below.
Over the top (OTT) subscribers of a platform are segregated into three categories: i) Kid, ii) Elder, and iii) Others. Some of the subscribers used one app and the others used multiple apps to access the platform. The figure below shows the percentage of the total number of subscribers in 2023 and 2024 who belong to the ‘Kid’ and ‘Elder’ categories.
| Category (% of total subscribers) | 2023 | 2024 |
|---|---|---|
| Kid | 15% | 20% |
| Elder | 20% | 30% |
| Others (balance) | 65% | 50% |
The following additional facts are known about the numbers of subscribers.
1. The total number of subscribers increased by 10% from 2023 to 2024.
2. In 2024, 1/2 of the subscribers from the ‘Kid’ category and 2/3 of the subscribers from the ‘Elder’ category use one app.
3. In 2023, the number of subscribers from the ‘Kid’ category who used multiple apps was the same as the number of subscribers from the ‘Elder’ category who used one app.
4. 10,000 subscribers from the ‘Kid’ category used one app and 15,000 subscribers from the ‘Elder’ category used multiple apps in 2023.
What could be the minimum percentage of subscribers who used multiple apps in 2024?
Answer the following questions based on the information given below.
The table given below shows the amount, in grams, of carbohydrate, protein, fat and all other nutrients, per 100 grams of nutrients in seven foodgrains. The first column shows the foodgrain category and the second column its codename. The table has some missing values.

| Category | Codename | Carbohydrate | Protein | Fat | Other nutrients |
|---|---|---|---|---|---|
| Cereal | C1 | — | — | 0 | 12 |
| Cereal | C2 | — | — | 3 | 10 |
| Millet | M1 | 62 | 10 | — | — |
| Millet | M2 | — | — | 7 | 16 |
| Millet | M3 | 56 | — | 12 | — |
| Pseudo-cereal | P1 | 66 | — | — | 10 |
| Pseudo-cereal | P2 | — | 14 | — | 8 |
The following additional facts are known.
1. Both the pseudo-cereals had higher amounts of carbohydrate as well as higher amounts of protein than any millet.
2. Both the cereals had higher amounts of carbohydrate than any pseudo-cereal.
3. All the missing values of carbohydrate amounts (in grams) for all the foodgrains are non-zero multiples of 5.
4. All the missing values of protein, fat and other nutrients amounts (in grams) for all the foodgrains are non-zero multiples of 4.
5. P1 contained double the amount of protein that M3 contains.
How many foodgrains had a higher amount of carbohydrate per 100 grams of nutrients than M1?
Answer the following questions based on the information given below.
The table given below shows the amount, in grams, of carbohydrate, protein, fat and all other nutrients, per 100 grams of nutrients in seven foodgrains. The first column shows the foodgrain category and the second column its codename. The table has some missing values.
| Category | Codename | Carbohydrate | Protein | Fat | Other nutrients |
|---|---|---|---|---|---|
| Cereal | C1 | — | — | 0 | 12 |
| Cereal | C2 | — | — | 3 | 10 |
| Millet | M1 | 62 | 10 | — | — |
| Millet | M2 | — | — | 7 | 16 |
| Millet | M3 | 56 | — | 12 | — |
| Pseudo-cereal | P1 | 66 | — | — | 10 |
| Pseudo-cereal | P2 | — | 14 | — | 8 |
The following additional facts are known.
1. Both the pseudo-cereals had higher amounts of carbohydrate as well as higher amounts of protein than any millet.
2. Both the cereals had higher amounts of carbohydrate than any pseudo-cereal.
3. All the missing values of carbohydrate amounts (in grams) for all the foodgrains are non-zero multiples of 5.
4. All the missing values of protein, fat and other nutrients amounts (in grams) for all the foodgrains are non-zero multiples of 4.
5. P1 contained double the amount of protein that M3 contains.
How many grams of protein were there in 100 grams of nutrients in M2?
Answer the following questions based on the information given below.
The table given below shows the amount, in grams, of carbohydrate, protein, fat and all other nutrients, per 100 grams of nutrients in seven foodgrains. The first column shows the foodgrain category and the second column its codename. The table has some missing values.
| Category | Codename | Carbohydrate | Protein | Fat | Other nutrients |
|---|---|---|---|---|---|
| Cereal | C1 | — | — | 0 | 12 |
| Cereal | C2 | — | — | 3 | 10 |
| Millet | M1 | 62 | 10 | — | — |
| Millet | M2 | — | — | 7 | 16 |
| Millet | M3 | 56 | — | 12 | — |
| Pseudo-cereal | P1 | 66 | — | — | 10 |
| Pseudo-cereal | P2 | — | 14 | — | 8 |
The following additional facts are known.
1. Both the pseudo-cereals had higher amounts of carbohydrate as well as higher amounts of protein than any millet.
2. Both the cereals had higher amounts of carbohydrate than any pseudo-cereal.
3. All the missing values of carbohydrate amounts (in grams) for all the foodgrains are non-zero multiples of 5.
4. All the missing values of protein, fat and other nutrients amounts (in grams) for all the foodgrains are non-zero multiples of 4.
5. P1 contained double the amount of protein that M3 contains.
How many grams of other nutrients were there in 100 grams of nutrients in M3?
Answer the following questions based on the information given below.
The table given below shows the amount, in grams, of carbohydrate, protein, fat and all other nutrients, per 100 grams of nutrients in seven foodgrains. The first column shows the foodgrain category and the second column its codename. The table has some missing values.
| Category | Codename | Carbohydrate | Protein | Fat | Other nutrients |
|---|---|---|---|---|---|
| Cereal | C1 | — | — | 0 | 12 |
| Cereal | C2 | — | — | 3 | 10 |
| Millet | M1 | 62 | 10 | — | — |
| Millet | M2 | — | — | 7 | 16 |
| Millet | M3 | 56 | — | 12 | — |
| Pseudo-cereal | P1 | 66 | — | — | 10 |
| Pseudo-cereal | P2 | — | 14 | — | 8 |
The following additional facts are known.
1. Both the pseudo-cereals had higher amounts of carbohydrate as well as higher amounts of protein than any millet.
2. Both the cereals had higher amounts of carbohydrate than any pseudo-cereal.
3. All the missing values of carbohydrate amounts (in grams) for all the foodgrains are non-zero multiples of 5.
4. All the missing values of protein, fat and other nutrients amounts (in grams) for all the foodgrains are non-zero multiples of 4.
5. P1 contained double the amount of protein that M3 contains.
What is the median of the number of grams of protein in 100 grams of nutrients among these food grains?
Answer the following questions based on the information given below.
Out of 10 countries -- Country 1 through Country 10 -- Country 9 has the highest gross domestic product (GDP), and Country 10 has the highest GDP per capita. GDP per capita is the GDP of a country divided by its population. The table below provides the following data about Country 1 through Country 8 for the year 2024.
• Column 1 gives the country's identity.
• Column 2 gives the country’s GDP as a fraction of the GDP of Country 9.
• Column 3 gives the country’s GDP per capita as a fraction of the GDP per capita of Country 10.
• Column 4 gives the country’s annual GDP growth rate.
• Column 5 gives the country’s annual population growth rate.

| Country | GDP (fraction of C9) | GDP per capita (fraction of C10) | GDP growth rate | Population growth rate |
|---|---|---|---|---|
| Country 1 | 0.15 | 0.41 | 0.2% | -0.12% |
| Country 2 | 0.14 | 0.25 | 0.9% | -0.41% |
| Country 3 | 0.13 | 0.02 | 6.5% | 0.70% |
| Country 4 | 0.12 | 0.38 | 0.5% | 0.49% |
| Country 5 | 0.10 | 0.36 | 0.7% | 0.31% |
| Country 6 | 0.08 | 0.08 | 3.2% | 0.61% |
| Country 7 | 0.08 | 0.30 | 0.7% | -0.11% |
| Country 8 | 0.07 | 0.41 | 1.2% | 0.71% |
Assume that the GDP growth rates and population growth rates of the countries will remain constant for the next three years.
Which one among the countries 1 through 8, has the smallest population in 2024?
Answer the following questions based on the information given below.
Out of 10 countries -- Country 1 through Country 10 -- Country 9 has the highest gross domestic product (GDP), and Country 10 has the highest GDP per capita. GDP per capita is the GDP of a country divided by its population. The table below provides the following data about Country 1 through Country 8 for the year 2024.
• Column 1 gives the country's identity.
• Column 2 gives the country’s GDP as a fraction of the GDP of Country 9.
• Column 3 gives the country’s GDP per capita as a fraction of the GDP per capita of Country 10.
• Column 4 gives the country’s annual GDP growth rate.
• Column 5 gives the country’s annual population growth rate.
| Country | GDP (fraction of C9) | GDP per capita (fraction of C10) | GDP growth rate | Population growth rate |
|---|---|---|---|---|
| Country 1 | 0.15 | 0.41 | 0.2% | -0.12% |
| Country 2 | 0.14 | 0.25 | 0.9% | -0.41% |
| Country 3 | 0.13 | 0.02 | 6.5% | 0.70% |
| Country 4 | 0.12 | 0.38 | 0.5% | 0.49% |
| Country 5 | 0.10 | 0.36 | 0.7% | 0.31% |
| Country 6 | 0.08 | 0.08 | 3.2% | 0.61% |
| Country 7 | 0.08 | 0.30 | 0.7% | -0.11% |
| Country 8 | 0.07 | 0.41 | 1.2% | 0.71% |
Assume that the GDP growth rates and population growth rates of the countries will remain constant for the next three years.
The ratio of Country 4’s GDP to Country 5’s GDP in 2026 will be closest to
Answer the following questions based on the information given below.
Out of 10 countries -- Country 1 through Country 10 -- Country 9 has the highest gross domestic product (GDP), and Country 10 has the highest GDP per capita. GDP per capita is the GDP of a country divided by its population. The table below provides the following data about Country 1 through Country 8 for the year 2024.
• Column 1 gives the country's identity.
• Column 2 gives the country’s GDP as a fraction of the GDP of Country 9.
• Column 3 gives the country’s GDP per capita as a fraction of the GDP per capita of Country 10.
• Column 4 gives the country’s annual GDP growth rate.
• Column 5 gives the country’s annual population growth rate.
| Country | GDP (fraction of C9) | GDP per capita (fraction of C10) | GDP growth rate | Population growth rate |
|---|---|---|---|---|
| Country 1 | 0.15 | 0.41 | 0.2% | -0.12% |
| Country 2 | 0.14 | 0.25 | 0.9% | -0.41% |
| Country 3 | 0.13 | 0.02 | 6.5% | 0.70% |
| Country 4 | 0.12 | 0.38 | 0.5% | 0.49% |
| Country 5 | 0.10 | 0.36 | 0.7% | 0.31% |
| Country 6 | 0.08 | 0.08 | 3.2% | 0.61% |
| Country 7 | 0.08 | 0.30 | 0.7% | -0.11% |
| Country 8 | 0.07 | 0.41 | 1.2% | 0.71% |
Assume that the GDP growth rates and population growth rates of the countries will remain constant for the next three years.
Which one among the countries 1, 4, 5, and 7 will have the largest population in 2027?
Answer the following questions based on the information given below.
Out of 10 countries -- Country 1 through Country 10 -- Country 9 has the highest gross domestic product (GDP), and Country 10 has the highest GDP per capita. GDP per capita is the GDP of a country divided by its population. The table below provides the following data about Country 1 through Country 8 for the year 2024.
• Column 1 gives the country's identity.
• Column 2 gives the country’s GDP as a fraction of the GDP of Country 9.
• Column 3 gives the country’s GDP per capita as a fraction of the GDP per capita of Country 10.
• Column 4 gives the country’s annual GDP growth rate.
• Column 5 gives the country’s annual population growth rate.
| Country | GDP (fraction of C9) | GDP per capita (fraction of C10) | GDP growth rate | Population growth rate |
|---|---|---|---|---|
| Country 1 | 0.15 | 0.41 | 0.2% | -0.12% |
| Country 2 | 0.14 | 0.25 | 0.9% | -0.41% |
| Country 3 | 0.13 | 0.02 | 6.5% | 0.70% |
| Country 4 | 0.12 | 0.38 | 0.5% | 0.49% |
| Country 5 | 0.10 | 0.36 | 0.7% | 0.31% |
| Country 6 | 0.08 | 0.08 | 3.2% | 0.61% |
| Country 7 | 0.08 | 0.30 | 0.7% | -0.11% |
| Country 8 | 0.07 | 0.41 | 1.2% | 0.71% |
Assume that the GDP growth rates and population growth rates of the countries will remain constant for the next three years.
For how many countries among Country 1 through Country 8 will the GDP per capita in 2027 be lower than that in 2024?
Answer the next 5 questions based on the information given below:
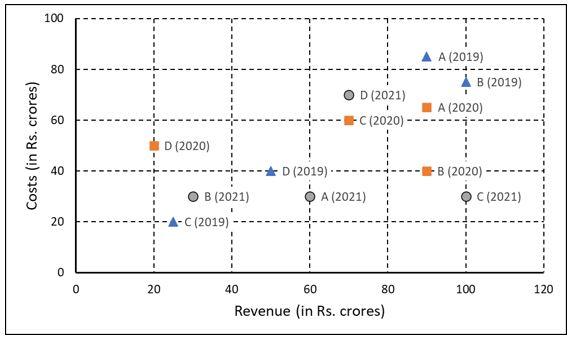
The two plots below show data for four companies code-named A, B, C, and D over three years - 2019, 2020, and 2021.
The first plot shows the revenues and costs incurred by the companies during these years. For example, in 2021, company C earned Rs.100 crores in revenue and spent Rs.30 crores. The profit of a company is defined as its revenue minus its costs.
 âââââââ
The second plot shows the number of employees employed by the company (employee strength) at the start of each of these three years, as well as the number of new employees hired each year (new hires). For example, Company B had 250 employees at the start of 2021, and 30 new employees joined the company during the year.
 âââââââ
Considering all three years, which company had the highest annual profit?
Answer the next 5 questions based on the information given below:
The two plots below show data for four companies code-named A, B, C, and D over three years - 2019, 2020, and 2021.
The first plot shows the revenues and costs incurred by the companies during these years. For example, in 2021, company C earned Rs.100 crores in revenue and spent Rs.30 crores. The profit of a company is defined as its revenue minus its costs.
âââââââ
The second plot shows the number of employees employed by the company (employee strength) at the start of each of these three years, as well as the number of new employees hired each year (new hires). For example, Company B had 250 employees at the start of 2021, and 30 new employees joined the company during the year.
âââââââ
Which of the four companies experienced the highest annual loss in any of the years?
Answer the next 5 questions based on the information given below:
The two plots below show data for four companies code-named A, B, C, and D over three years - 2019, 2020, and 2021.
The first plot shows the revenues and costs incurred by the companies during these years. For example, in 2021, company C earned Rs.100 crores in revenue and spent Rs.30 crores. The profit of a company is defined as its revenue minus its costs.
âââââââ
The second plot shows the number of employees employed by the company (employee strength) at the start of each of these three years, as well as the number of new employees hired each year (new hires). For example, Company B had 250 employees at the start of 2021, and 30 new employees joined the company during the year.
âââââââ
The ratio of a company's annual profit to its annual costs is a measure of its performance. Which of the four companies had the lowest value of this ratio in 2019?
Answer the next 5 questions based on the information given below:
The two plots below show data for four companies code-named A, B, C, and D over three years - 2019, 2020, and 2021.
The first plot shows the revenues and costs incurred by the companies during these years. For example, in 2021, company C earned Rs.100 crores in revenue and spent Rs.30 crores. The profit of a company is defined as its revenue minus its costs.
âââââââ
The second plot shows the number of employees employed by the company (employee strength) at the start of each of these three years, as well as the number of new employees hired each year (new hires). For example, Company B had 250 employees at the start of 2021, and 30 new employees joined the company during the year.
âââââââ
The total number of employees lost in 2019 and 2020 was the least for:
Answer the next 5 questions based on the information given below:
The two plots below show data for four companies code-named A, B, C, and D over three years - 2019, 2020, and 2021.
The first plot shows the revenues and costs incurred by the companies during these years. For example, in 2021, company C earned Rs.100 crores in revenue and spent Rs.30 crores. The profit of a company is defined as its revenue minus its costs.
âââââââ
The second plot shows the number of employees employed by the company (employee strength) at the start of each of these three years, as well as the number of new employees hired each year (new hires). For example, Company B had 250 employees at the start of 2021, and 30 new employees joined the company during the year.
âââââââ
Profit per employee is the ratio of a company's profit to its employee strength. For this purpose, the employee strength in a year is the average of the employee strength at the beginning of that year and the beginning of the next year. In 2020, which of the four companies had the highest profit per employee?
Answer the next 5 questions based on the information given below:
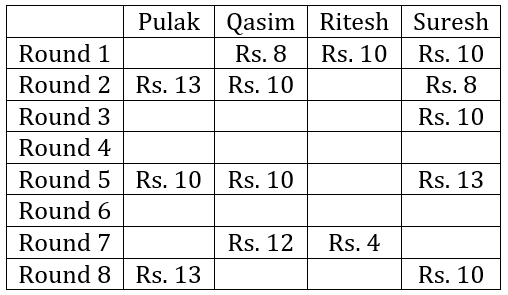
Pulak, Qasim, Ritesh, and Suresh participated in a tournament comprising of eight rounds. In each round, they formed two pairs, with each of them being in exactly one pair. The only restriction in the pairing was that the pairs would change in successive rounds. For example, if Pulak formed a pair with Qasim in the first round, then he would have to form a pair with Ritesh or Suresh in the second round. He would be free to pair with Qasim again in the third round. In each round, each pair decided whether to play the game in that round or not. If they decided not to play, then no money was exchanged between them. If they decided to play, they had to bet either â¹1 or â¹2 in that round. For example, if they chose to bet â¹2, then the player winning the game got â¹2 from the one losing the game.
At the beginning of the tournament, the players had â¹10 each. The following table shows partial information about the amounts that the players had at the end of each of the eight rounds. It shows every time a player had â¹10 at the end of a round, as well as every time, at the end of a round, a player had either the minimum or the maximum amount that he would have had across the eight rounds. For example, Suresh had â¹10 at the end of Rounds 1, 3, and 8 and not after any of the other rounds. The maximum amount that he had at the end of any round was â¹13 (at the end of Round 5), and the minimum amount he had at the end of any round was â¹8 (at the end of Round 2). At the end of all other rounds, he must have had either â¹9, â¹11, or â¹12.
It was also known that Pulak and Qasim had the same amount of money with them at the end of Round 4.
 âââââââ
What BEST can be said about the amount of money that Ritesh had with him at the end of Round 8?
Answer the next 5 questions based on the information given below:
Pulak, Qasim, Ritesh, and Suresh participated in a tournament comprising of eight rounds. In each round, they formed two pairs, with each of them being in exactly one pair. The only restriction in the pairing was that the pairs would change in successive rounds. For example, if Pulak formed a pair with Qasim in the first round, then he would have to form a pair with Ritesh or Suresh in the second round. He would be free to pair with Qasim again in the third round. In each round, each pair decided whether to play the game in that round or not. If they decided not to play, then no money was exchanged between them. If they decided to play, they had to bet either â¹1 or â¹2 in that round. For example, if they chose to bet â¹2, then the player winning the game got â¹2 from the one losing the game.
At the beginning of the tournament, the players had â¹10 each. The following table shows partial information about the amounts that the players had at the end of each of the eight rounds. It shows every time a player had â¹10 at the end of a round, as well as every time, at the end of a round, a player had either the minimum or the maximum amount that he would have had across the eight rounds. For example, Suresh had â¹10 at the end of Rounds 1, 3, and 8 and not after any of the other rounds. The maximum amount that he had at the end of any round was â¹13 (at the end of Round 5), and the minimum amount he had at the end of any round was â¹8 (at the end of Round 2). At the end of all other rounds, he must have had either â¹9, â¹11, or â¹12.
It was also known that Pulak and Qasim had the same amount of money with them at the end of Round 4.
âââââââ
What BEST can be said about the amount of money that Pulak had with him at the end of Round 6?
Answer the next 5 questions based on the information given below:
Pulak, Qasim, Ritesh, and Suresh participated in a tournament comprising of eight rounds. In each round, they formed two pairs, with each of them being in exactly one pair. The only restriction in the pairing was that the pairs would change in successive rounds. For example, if Pulak formed a pair with Qasim in the first round, then he would have to form a pair with Ritesh or Suresh in the second round. He would be free to pair with Qasim again in the third round. In each round, each pair decided whether to play the game in that round or not. If they decided not to play, then no money was exchanged between them. If they decided to play, they had to bet either â¹1 or â¹2 in that round. For example, if they chose to bet â¹2, then the player winning the game got â¹2 from the one losing the game.
At the beginning of the tournament, the players had â¹10 each. The following table shows partial information about the amounts that the players had at the end of each of the eight rounds. It shows every time a player had â¹10 at the end of a round, as well as every time, at the end of a round, a player had either the minimum or the maximum amount that he would have had across the eight rounds. For example, Suresh had â¹10 at the end of Rounds 1, 3, and 8 and not after any of the other rounds. The maximum amount that he had at the end of any round was â¹13 (at the end of Round 5), and the minimum amount he had at the end of any round was â¹8 (at the end of Round 2). At the end of all other rounds, he must have had either â¹9, â¹11, or â¹12.
It was also known that Pulak and Qasim had the same amount of money with them at the end of Round 4.
âââââââ
How much money (in â¹) did Ritesh have at the end of Round 4?
Answer the next 5 questions based on the information given below:
Pulak, Qasim, Ritesh, and Suresh participated in a tournament comprising of eight rounds. In each round, they formed two pairs, with each of them being in exactly one pair. The only restriction in the pairing was that the pairs would change in successive rounds. For example, if Pulak formed a pair with Qasim in the first round, then he would have to form a pair with Ritesh or Suresh in the second round. He would be free to pair with Qasim again in the third round. In each round, each pair decided whether to play the game in that round or not. If they decided not to play, then no money was exchanged between them. If they decided to play, they had to bet either â¹1 or â¹2 in that round. For example, if they chose to bet â¹2, then the player winning the game got â¹2 from the one losing the game.
At the beginning of the tournament, the players had â¹10 each. The following table shows partial information about the amounts that the players had at the end of each of the eight rounds. It shows every time a player had â¹10 at the end of a round, as well as every time, at the end of a round, a player had either the minimum or the maximum amount that he would have had across the eight rounds. For example, Suresh had â¹10 at the end of Rounds 1, 3, and 8 and not after any of the other rounds. The maximum amount that he had at the end of any round was â¹13 (at the end of Round 5), and the minimum amount he had at the end of any round was â¹8 (at the end of Round 2). At the end of all other rounds, he must have had either â¹9, â¹11, or â¹12.
It was also known that Pulak and Qasim had the same amount of money with them at the end of Round 4.
âââââââ
How many games were played with a bet of â¹2?
Answer the next 5 questions based on the information given below:
Pulak, Qasim, Ritesh, and Suresh participated in a tournament comprising of eight rounds. In each round, they formed two pairs, with each of them being in exactly one pair. The only restriction in the pairing was that the pairs would change in successive rounds. For example, if Pulak formed a pair with Qasim in the first round, then he would have to form a pair with Ritesh or Suresh in the second round. He would be free to pair with Qasim again in the third round. In each round, each pair decided whether to play the game in that round or not. If they decided not to play, then no money was exchanged between them. If they decided to play, they had to bet either â¹1 or â¹2 in that round. For example, if they chose to bet â¹2, then the player winning the game got â¹2 from the one losing the game.
At the beginning of the tournament, the players had â¹10 each. The following table shows partial information about the amounts that the players had at the end of each of the eight rounds. It shows every time a player had â¹10 at the end of a round, as well as every time, at the end of a round, a player had either the minimum or the maximum amount that he would have had across the eight rounds. For example, Suresh had â¹10 at the end of Rounds 1, 3, and 8 and not after any of the other rounds. The maximum amount that he had at the end of any round was â¹13 (at the end of Round 5), and the minimum amount he had at the end of any round was â¹8 (at the end of Round 2). At the end of all other rounds, he must have had either â¹9, â¹11, or â¹12.
It was also known that Pulak and Qasim had the same amount of money with them at the end of Round 4.
âââââââ
Which of the following pairings was made in Round 5?
Answer the next 5 questions based on the information given below:
In the following, a year corresponds to 1st of January of that year.
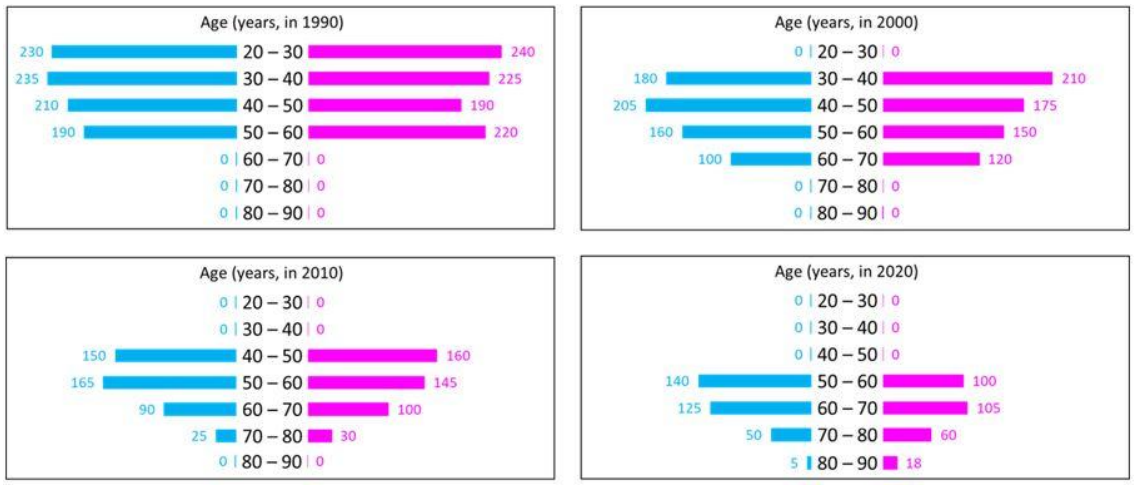
A study to determine the mortality rate for a disease began in 1980. The study chose 1000 males and 1000 females and followed them for forty years or until they died, whichever came first. The 1000 males chosen in 1980 consisted of 250 each of ages 10 to less than 20, 20 to less than 30, 30 to less than 40, and 40 to less than 50. The 1000 females chosen in 1980 also consisted of 250 each of ages 10 to less than 20, 20 to less than 30, 30 to less than 40, and 40 to less than 50.
The four figures below depict the age profile of those among the 2000 individuals who were still alive in 1990, 2000, 2010, and 2020. The blue bars in each figure represent the number of males in each age group at that point in time, while the pink bars represent the number of females in each age group at that point in time. The numbers next to the bars give the exact numbers being represented by the bars. For example, we know that 230 males among those tracked and who were alive in 1990 were aged between 20 and 30.
 âââââââ
In 2000, what was the ratio of the number of dead males to dead females among those being tracked?
Answer the next 5 questions based on the information given below:
In the following, a year corresponds to 1st of January of that year.
A study to determine the mortality rate for a disease began in 1980. The study chose 1000 males and 1000 females and followed them for forty years or until they died, whichever came first. The 1000 males chosen in 1980 consisted of 250 each of ages 10 to less than 20, 20 to less than 30, 30 to less than 40, and 40 to less than 50. The 1000 females chosen in 1980 also consisted of 250 each of ages 10 to less than 20, 20 to less than 30, 30 to less than 40, and 40 to less than 50.
The four figures below depict the age profile of those among the 2000 individuals who were still alive in 1990, 2000, 2010, and 2020. The blue bars in each figure represent the number of males in each age group at that point in time, while the pink bars represent the number of females in each age group at that point in time. The numbers next to the bars give the exact numbers being represented by the bars. For example, we know that 230 males among those tracked and who were alive in 1990 were aged between 20 and 30.
âââââââ
How many people who were being tracked and who were between 30 and 40 years of age in 1980 survived until 2010?
Answer the next 5 questions based on the information given below:
In the following, a year corresponds to 1st of January of that year.
A study to determine the mortality rate for a disease began in 1980. The study chose 1000 males and 1000 females and followed them for forty years or until they died, whichever came first. The 1000 males chosen in 1980 consisted of 250 each of ages 10 to less than 20, 20 to less than 30, 30 to less than 40, and 40 to less than 50. The 1000 females chosen in 1980 also consisted of 250 each of ages 10 to less than 20, 20 to less than 30, 30 to less than 40, and 40 to less than 50.
The four figures below depict the age profile of those among the 2000 individuals who were still alive in 1990, 2000, 2010, and 2020. The blue bars in each figure represent the number of males in each age group at that point in time, while the pink bars represent the number of females in each age group at that point in time. The numbers next to the bars give the exact numbers being represented by the bars. For example, we know that 230 males among those tracked and who were alive in 1990 were aged between 20 and 30.
âââââââ
How many individuals who were being tracked and who were less than 30 years of age in 1980 survived until 2020?
Answer the next 5 questions based on the information given below:
In the following, a year corresponds to 1st of January of that year.
A study to determine the mortality rate for a disease began in 1980. The study chose 1000 males and 1000 females and followed them for forty years or until they died, whichever came first. The 1000 males chosen in 1980 consisted of 250 each of ages 10 to less than 20, 20 to less than 30, 30 to less than 40, and 40 to less than 50. The 1000 females chosen in 1980 also consisted of 250 each of ages 10 to less than 20, 20 to less than 30, 30 to less than 40, and 40 to less than 50.
The four figures below depict the age profile of those among the 2000 individuals who were still alive in 1990, 2000, 2010, and 2020. The blue bars in each figure represent the number of males in each age group at that point in time, while the pink bars represent the number of females in each age group at that point in time. The numbers next to the bars give the exact numbers being represented by the bars. For example, we know that 230 males among those tracked and who were alive in 1990 were aged between 20 and 30.
âââââââ
How many of the males who were being tracked and who were between 20 and 30 yearsof age in 1980 died in the period 2000 to 2010?
Answer the next 5 questions based on the information given below:
In the following, a year corresponds to 1st of January of that year.
A study to determine the mortality rate for a disease began in 1980. The study chose 1000 males and 1000 females and followed them for forty years or until they died, whichever came first. The 1000 males chosen in 1980 consisted of 250 each of ages 10 to less than 20, 20 to less than 30, 30 to less than 40, and 40 to less than 50. The 1000 females chosen in 1980 also consisted of 250 each of ages 10 to less than 20, 20 to less than 30, 30 to less than 40, and 40 to less than 50.
The four figures below depict the age profile of those among the 2000 individuals who were still alive in 1990, 2000, 2010, and 2020. The blue bars in each figure represent the number of males in each age group at that point in time, while the pink bars represent the number of females in each age group at that point in time. The numbers next to the bars give the exact numbers being represented by the bars. For example, we know that 230 males among those tracked and who were alive in 1990 were aged between 20 and 30.
âââââââ
How many of the females who were being tracked and who were between 20 and 30 years of age in 1980 died between the ages of 50 and 60?
[Note: There is an ambiguity in this question and hence was discarded by IIM Bangalore.]
Answer the next 4 questions based on the information given
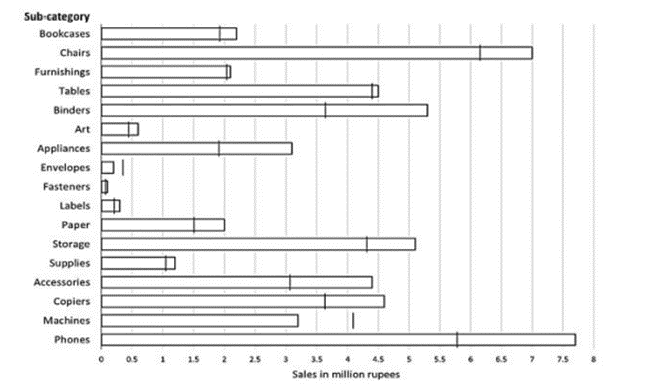
The horizontal bars in the above diagram represent 2020 aggregate sales (in â¹ million) of a company for the different subcategories of its products. The top four product subcategories (Bookcases, Chairs, Furnishings, Tables) belong to furniture product category; the bottom four product subcategories (Accessories, Copiers, Machines, Phones) belong to the technology product category while all other product subcategories belong to the office supply product category. For each of the product subcategories, there is a vertical line indicating the sales of the corresponding subcategory in 2019.
 âââââââ
The total sales (in â¹ million) in 2019 from products in office supplies category is closest to
Answer the next 4 questions based on the information given
The horizontal bars in the above diagram represent 2020 aggregate sales (in â¹ million) of a company for the different subcategories of its products. The top four product subcategories (Bookcases, Chairs, Furnishings, Tables) belong to furniture product category; the bottom four product subcategories (Accessories, Copiers, Machines, Phones) belong to the technology product category while all other product subcategories belong to the office supply product category. For each of the product subcategories, there is a vertical line indicating the sales of the corresponding subcategory in 2019.
âââââââ
The percentage increase in sales in Furniture category from 2019 to 2020 is closest to
Answer the next 4 questions based on the information given
The horizontal bars in the above diagram represent 2020 aggregate sales (in â¹ million) of a company for the different subcategories of its products. The top four product subcategories (Bookcases, Chairs, Furnishings, Tables) belong to furniture product category; the bottom four product subcategories (Accessories, Copiers, Machines, Phones) belong to the technology product category while all other product subcategories belong to the office supply product category. For each of the product subcategories, there is a vertical line indicating the sales of the corresponding subcategory in 2019.
âââââââ
How many subcategories had sales of â¹ 4 million or more in 2019 and registered an increase in sales in excess of 25% in 2020?
Answer the next 4 questions based on the information given
The horizontal bars in the above diagram represent 2020 aggregate sales (in â¹ million) of a company for the different subcategories of its products. The top four product subcategories (Bookcases, Chairs, Furnishings, Tables) belong to furniture product category; the bottom four product subcategories (Accessories, Copiers, Machines, Phones) belong to the technology product category while all other product subcategories belong to the office supply product category. For each of the product subcategories, there is a vertical line indicating the sales of the corresponding subcategory in 2019.
âââââââ
The improvement index for a category is the maximum percentage increase in sales from 2019 to 2020 among any of its subcategories. The correct order of categories in increasing order of this improvement index is
Answer the next 4 questions based on the information given
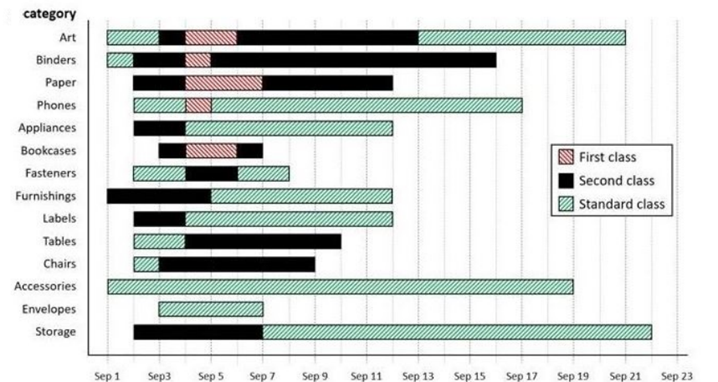
The different bars in the diagram above provide information about different orders in various categories (Art, Binders, ….) that were booked in the first two weeks of September of a store for one client. The colour and pattern of a bar denotes the ship mode (First Class / Second Class / Standard Class). The left end point of a bar indicates the booking day of the order, while the right end point indicates the dispatch day of the order. The difference between the dispatch day and the booking day (measured in terms of the number of days) is called the processing time of the order. For the same category, an order is considered for booking only after the previous order of the same category is dispatched. No two consecutive orders of the same category had identical ship mode during this period.
For example, there were only two orders in the furnishing category during this period. The first one was shipped in the Second Class. It was booked on Sep 1 and dispatched on Sep 5. The second order was shipped in the Standard class. It was booked on Sep 5 (although the order might have been placed before that) and dispatched on Sep 12. So the processing times were 4 and 7 days respectively for these orders.
 âââââââ
How many days between Sep 1 and Sep 14 (both inclusive) had no booking from this client considering all the above categories?
Answer the next 4 questions based on the information given
The different bars in the diagram above provide information about different orders in various categories (Art, Binders, ….) that were booked in the first two weeks of September of a store for one client. The colour and pattern of a bar denotes the ship mode (First Class / Second Class / Standard Class). The left end point of a bar indicates the booking day of the order, while the right end point indicates the dispatch day of the order. The difference between the dispatch day and the booking day (measured in terms of the number of days) is called the processing time of the order. For the same category, an order is considered for booking only after the previous order of the same category is dispatched. No two consecutive orders of the same category had identical ship mode during this period.
For example, there were only two orders in the furnishing category during this period. The first one was shipped in the Second Class. It was booked on Sep 1 and dispatched on Sep 5. The second order was shipped in the Standard class. It was booked on Sep 5 (although the order might have been placed before that) and dispatched on Sep 12. So the processing times were 4 and 7 days respectively for these orders.
âââââââ
What was the average processing time of all orders in the categories which had only one type of ship mode?
Answer the next 4 questions based on the information given
The different bars in the diagram above provide information about different orders in various categories (Art, Binders, ….) that were booked in the first two weeks of September of a store for one client. The colour and pattern of a bar denotes the ship mode (First Class / Second Class / Standard Class). The left end point of a bar indicates the booking day of the order, while the right end point indicates the dispatch day of the order. The difference between the dispatch day and the booking day (measured in terms of the number of days) is called the processing time of the order. For the same category, an order is considered for booking only after the previous order of the same category is dispatched. No two consecutive orders of the same category had identical ship mode during this period.
For example, there were only two orders in the furnishing category during this period. The first one was shipped in the Second Class. It was booked on Sep 1 and dispatched on Sep 5. The second order was shipped in the Standard class. It was booked on Sep 5 (although the order might have been placed before that) and dispatched on Sep 12. So the processing times were 4 and 7 days respectively for these orders.
âââââââ
The sequence of categories -- Art, Binders, Paper and Phones -- in decreasing order of average processing time of their orders in this period is:
Answer the next 4 questions based on the information given
The different bars in the diagram above provide information about different orders in various categories (Art, Binders, ….) that were booked in the first two weeks of September of a store for one client. The colour and pattern of a bar denotes the ship mode (First Class / Second Class / Standard Class). The left end point of a bar indicates the booking day of the order, while the right end point indicates the dispatch day of the order. The difference between the dispatch day and the booking day (measured in terms of the number of days) is called the processing time of the order. For the same category, an order is considered for booking only after the previous order of the same category is dispatched. No two consecutive orders of the same category had identical ship mode during this period.
For example, there were only two orders in the furnishing category during this period. The first one was shipped in the Second Class. It was booked on Sep 1 and dispatched on Sep 5. The second order was shipped in the Standard class. It was booked on Sep 5 (although the order might have been placed before that) and dispatched on Sep 12. So the processing times were 4 and 7 days respectively for these orders.
âââââââ
Approximately what percentage of orders had a processing time of one day during the period Sep 1 to Sep 22 (both dates inclusive)?
Answer the next 4 questions based on the information given
The figure above shows the schedule of four employees – Abani, Bahni, Danni and Tinni – whom Dhoni supervised in 2020. Altogether there were five projects which started and concluded in 2020 in which they were involved. For each of these projects and for each employee, the starting day was at the beginning of a month and the concluding day was the end of a month, and these are indicated by the left and right end points of the corresponding horizontal bars. The number within each bar indicates the percentage of assigned work completed by the employee for that project, as assessed by Dhoni.
For each employee, his/her total project-month (in 2020) is the sum of the number of months (s)he worked across the five project, while his/her annual completion index is the weightage average of the completion percentage assigned from the different projects, with the weights being the corresponding number of months (s)he worked in these projects. For each project, the total employee-month is the sum of the number of months four employees worked in this project, while its completion index is the weightage average of the completion percentage assigned for the employees who worked in this project, with the weights being the corresponding number of months they worked in this project.
 âââââââ
Which of the following statements is/are true?
I: The total project-month was the same for the four employees.
II: The total employee-month was the same for the five projects.
Answer the next 4 questions based on the information given
The figure above shows the schedule of four employees – Abani, Bahni, Danni and Tinni – whom Dhoni supervised in 2020. Altogether there were five projects which started and concluded in 2020 in which they were involved. For each of these projects and for each employee, the starting day was at the beginning of a month and the concluding day was the end of a month, and these are indicated by the left and right end points of the corresponding horizontal bars. The number within each bar indicates the percentage of assigned work completed by the employee for that project, as assessed by Dhoni.
For each employee, his/her total project-month (in 2020) is the sum of the number of months (s)he worked across the five project, while his/her annual completion index is the weightage average of the completion percentage assigned from the different projects, with the weights being the corresponding number of months (s)he worked in these projects. For each project, the total employee-month is the sum of the number of months four employees worked in this project, while its completion index is the weightage average of the completion percentage assigned for the employees who worked in this project, with the weights being the corresponding number of months they worked in this project.
âââââââ
Which employees did not work in multiple projects for any of the months in 2020?
Answer the next 4 questions based on the information given
The figure above shows the schedule of four employees – Abani, Bahni, Danni and Tinni – whom Dhoni supervised in 2020. Altogether there were five projects which started and concluded in 2020 in which they were involved. For each of these projects and for each employee, the starting day was at the beginning of a month and the concluding day was the end of a month, and these are indicated by the left and right end points of the corresponding horizontal bars. The number within each bar indicates the percentage of assigned work completed by the employee for that project, as assessed by Dhoni.
For each employee, his/her total project-month (in 2020) is the sum of the number of months (s)he worked across the five project, while his/her annual completion index is the weightage average of the completion percentage assigned from the different projects, with the weights being the corresponding number of months (s)he worked in these projects. For each project, the total employee-month is the sum of the number of months four employees worked in this project, while its completion index is the weightage average of the completion percentage assigned for the employees who worked in this project, with the weights being the corresponding number of months they worked in this project.
âââââââ
The project duration, measured in terms of the number of months, is the time during which at least one employee worked in the project. Which of the following pairs of the projects had the same duration?
Answer the next 4 questions based on the information given
The figure above shows the schedule of four employees – Abani, Bahni, Danni and Tinni – whom Dhoni supervised in 2020. Altogether there were five projects which started and concluded in 2020 in which they were involved. For each of these projects and for each employee, the starting day was at the beginning of a month and the concluding day was the end of a month, and these are indicated by the left and right end points of the corresponding horizontal bars. The number within each bar indicates the percentage of assigned work completed by the employee for that project, as assessed by Dhoni.
For each employee, his/her total project-month (in 2020) is the sum of the number of months (s)he worked across the five project, while his/her annual completion index is the weightage average of the completion percentage assigned from the different projects, with the weights being the corresponding number of months (s)he worked in these projects. For each project, the total employee-month is the sum of the number of months four employees worked in this project, while its completion index is the weightage average of the completion percentage assigned for the employees who worked in this project, with the weights being the corresponding number of months they worked in this project.
âââââââ
The list of employees in decreasing order of annual completion index is:
Answer the next 4 questions based on the information given below.
The local office of the APP-CAB company evaluates the performance of five cab drivers, Arun, Barun, Chandan, Damodaran, and Eman for their monthly payment based on ratings infive different parameters (P1 to P5) as given below:
P1: timely arrival
P2: behaviour
P3: comfortable ride
P4: driver's familiarity with the route
P5: value for money
Based on feedback from the customers, the office assigns a rating from 1 to 5 in each of these parameters. Each rating is an integer from a low value of 1 to a high value of 5. The final rating of a driver is the average of his ratings in these five parameters. The monthly payment of the drivers has two parts – a fixed payment and final rating-based bonus. If a driver gets a rating of 1 in any of the parameters, he is not eligible to get bonus. To be eligible for bonus a driver also needs to get a rating of five in at least one of the parameters.
The partial information related to the ratings of the drivers in different parameters and the monthly payment structure (in rupees) is given in the table below:
 âââââââ
The following additional facts are known.
- Arun and Barun have got a rating of 5 in exactly one of the parameters. Chandan has got a rating of 5 in exactly two parameters.
- None of drivers has got the same rating in three parameters.
If Damodaran does not get a bonus, what is the maximum possible value of his final rating?
Answer the next 4 questions based on the information given below.
The local office of the APP-CAB company evaluates the performance of five cab drivers, Arun, Barun, Chandan, Damodaran, and Eman for their monthly payment based on ratings infive different parameters (P1 to P5) as given below:
P1: timely arrival
P2: behaviour
P3: comfortable ride
P4: driver's familiarity with the route
P5: value for money
Based on feedback from the customers, the office assigns a rating from 1 to 5 in each of these parameters. Each rating is an integer from a low value of 1 to a high value of 5. The final rating of a driver is the average of his ratings in these five parameters. The monthly payment of the drivers has two parts – a fixed payment and final rating-based bonus. If a driver gets a rating of 1 in any of the parameters, he is not eligible to get bonus. To be eligible for bonus a driver also needs to get a rating of five in at least one of the parameters.
The partial information related to the ratings of the drivers in different parameters and the monthly payment structure (in rupees) is given in the table below:
âââââââ
The following additional facts are known.
- Arun and Barun have got a rating of 5 in exactly one of the parameters. Chandan has got a rating of 5 in exactly two parameters.
- None of drivers has got the same rating in three parameters.
If Eman gets a bonus, what is the minimum possible value of his final rating?
Answer the next 4 questions based on the information given below.
The local office of the APP-CAB company evaluates the performance of five cab drivers, Arun, Barun, Chandan, Damodaran, and Eman for their monthly payment based on ratings infive different parameters (P1 to P5) as given below:
P1: timely arrival
P2: behaviour
P3: comfortable ride
P4: driver's familiarity with the route
P5: value for money
Based on feedback from the customers, the office assigns a rating from 1 to 5 in each of these parameters. Each rating is an integer from a low value of 1 to a high value of 5. The final rating of a driver is the average of his ratings in these five parameters. The monthly payment of the drivers has two parts – a fixed payment and final rating-based bonus. If a driver gets a rating of 1 in any of the parameters, he is not eligible to get bonus. To be eligible for bonus a driver also needs to get a rating of five in at least one of the parameters.
The partial information related to the ratings of the drivers in different parameters and the monthly payment structure (in rupees) is given in the table below:
âââââââ
The following additional facts are known.
- Arun and Barun have got a rating of 5 in exactly one of the parameters. Chandan has got a rating of 5 in exactly two parameters.
- None of drivers has got the same rating in three parameters.
If all five drivers get bonus, what is the minimum possible value of the monthly payment (in rupees) that a driver gets?
Answer the next 4 questions based on the information given below.
The local office of the APP-CAB company evaluates the performance of five cab drivers, Arun, Barun, Chandan, Damodaran, and Eman for their monthly payment based on ratings infive different parameters (P1 to P5) as given below:
P1: timely arrival
P2: behaviour
P3: comfortable ride
P4: driver's familiarity with the route
P5: value for money
Based on feedback from the customers, the office assigns a rating from 1 to 5 in each of these parameters. Each rating is an integer from a low value of 1 to a high value of 5. The final rating of a driver is the average of his ratings in these five parameters. The monthly payment of the drivers has two parts – a fixed payment and final rating-based bonus. If a driver gets a rating of 1 in any of the parameters, he is not eligible to get bonus. To be eligible for bonus a driver also needs to get a rating of five in at least one of the parameters.
The partial information related to the ratings of the drivers in different parameters and the monthly payment structure (in rupees) is given in the table below:
âââââââ
The following additional facts are known.
- Arun and Barun have got a rating of 5 in exactly one of the parameters. Chandan has got a rating of 5 in exactly two parameters.
- None of drivers has got the same rating in three parameters.
If all five drivers get bonus, what is the maximum possible value of the monthly payment (in rupees) that a driver gets?
Answer the next 4 questions based on the information given below.
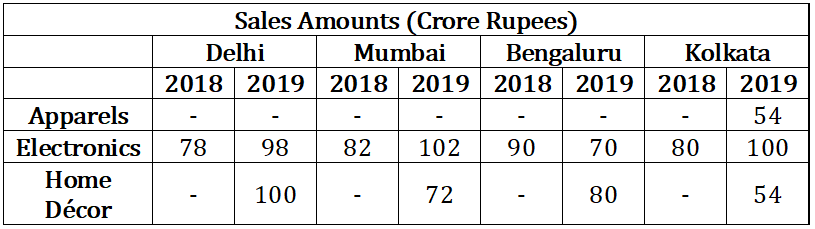
A chain of departmental stores has outlets in Delhi, Mumbai, Bengaluru and Kolkata. The sales are categorized by its three departments – ‘Apparel’, ‘Electronics’, and ‘HomeDecor’. An Accountant has been asked to prepare a summary of the 2018 and 2019 sales amounts for an internal report. He has collated partial information and prepared the following table.
 âââââââ
The following additional information is known.
- The sales amounts in the Apparel departments were the same for Delhi and Kolkata in 2018.
- The sales amounts in the Apparel departments were the same for Mumbai and Bengaluru in 2018. This sales amount matched the sales amount in the Apparel department for Delhi in 2019.
- The sales amounts in the HomeDecor departments were the same for Mumbai and Kolkata in 2018.
- The sum of the sales amounts of four Electronics departments increased by the same amount as the sum of the sales amounts of four Apparel departments from 2018 to 2019.
- The total sales amounts of the four HomeDecor departments increased by Rs 70 Crores from 2018 to 2019.
- The sales amounts in the HomeDecor departments of Delhi and Bengaluru each increased by Rs 20 Crores from 2018 to 2019.
- The sales amounts in the Apparel departments of Delhi and Bengaluru each increased by the same amount in 2019 from 2018. The sales amounts in the Apparel departments of Mumbai and Kolkata also each increased by the same amount in 2019 from 2018.
- The sales amounts in the Apparel departments of Delhi, Kolkata and Bengaluru in 2019 followed an Arithmetic
In HomeDecor departments of which cities were the sales amounts the highest in 2018 and 2019, respectively?
Answer the next 4 questions based on the information given below.
A chain of departmental stores has outlets in Delhi, Mumbai, Bengaluru and Kolkata. The sales are categorized by its three departments – ‘Apparel’, ‘Electronics’, and ‘HomeDecor’. An Accountant has been asked to prepare a summary of the 2018 and 2019 sales amounts for an internal report. He has collated partial information and prepared the following table.
âââââââ
The following additional information is known.
- The sales amounts in the Apparel departments were the same for Delhi and Kolkata in 2018.
- The sales amounts in the Apparel departments were the same for Mumbai and Bengaluru in 2018. This sales amount matched the sales amount in the Apparel department for Delhi in 2019.
- The sales amounts in the HomeDecor departments were the same for Mumbai and Kolkata in 2018.
- The sum of the sales amounts of four Electronics departments increased by the same amount as the sum of the sales amounts of four Apparel departments from 2018 to 2019.
- The total sales amounts of the four HomeDecor departments increased by Rs 70 Crores from 2018 to 2019.
- The sales amounts in the HomeDecor departments of Delhi and Bengaluru each increased by Rs 20 Crores from 2018 to 2019.
- The sales amounts in the Apparel departments of Delhi and Bengaluru each increased by the same amount in 2019 from 2018. The sales amounts in the Apparel departments of Mumbai and Kolkata also each increased by the same amount in 2019 from 2018.
- The sales amounts in the Apparel departments of Delhi, Kolkata and Bengaluru in 2019 followed an Arithmetic
What was the increase in sales amount, in Crore Rupees, in the Apparel department of Mumbai from 2018 to 2019?
Answer the next 4 questions based on the information given below.
A chain of departmental stores has outlets in Delhi, Mumbai, Bengaluru and Kolkata. The sales are categorized by its three departments – ‘Apparel’, ‘Electronics’, and ‘HomeDecor’. An Accountant has been asked to prepare a summary of the 2018 and 2019 sales amounts for an internal report. He has collated partial information and prepared the following table.
âââââââ
The following additional information is known.
- The sales amounts in the Apparel departments were the same for Delhi and Kolkata in 2018.
- The sales amounts in the Apparel departments were the same for Mumbai and Bengaluru in 2018. This sales amount matched the sales amount in the Apparel department for Delhi in 2019.
- The sales amounts in the HomeDecor departments were the same for Mumbai and Kolkata in 2018.
- The sum of the sales amounts of four Electronics departments increased by the same amount as the sum of the sales amounts of four Apparel departments from 2018 to 2019.
- The total sales amounts of the four HomeDecor departments increased by Rs 70 Crores from 2018 to 2019.
- The sales amounts in the HomeDecor departments of Delhi and Bengaluru each increased by Rs 20 Crores from 2018 to 2019.
- The sales amounts in the Apparel departments of Delhi and Bengaluru each increased by the same amount in 2019 from 2018. The sales amounts in the Apparel departments of Mumbai and Kolkata also each increased by the same amount in 2019 from 2018.
- The sales amounts in the Apparel departments of Delhi, Kolkata and Bengaluru in 2019 followed an Arithmetic
Among all the 12 departments (i.e., the 3 departments in each of the 4 cities), what was the maximum percentage increase in sales amount from 2018 to 2019?
Answer the next 4 questions based on the information given below.
A chain of departmental stores has outlets in Delhi, Mumbai, Bengaluru and Kolkata. The sales are categorized by its three departments – ‘Apparel’, ‘Electronics’, and ‘HomeDecor’. An Accountant has been asked to prepare a summary of the 2018 and 2019 sales amounts for an internal report. He has collated partial information and prepared the following table.
âââââââ
The following additional information is known.
- The sales amounts in the Apparel departments were the same for Delhi and Kolkata in 2018.
- The sales amounts in the Apparel departments were the same for Mumbai and Bengaluru in 2018. This sales amount matched the sales amount in the Apparel department for Delhi in 2019.
- The sales amounts in the HomeDecor departments were the same for Mumbai and Kolkata in 2018.
- The sum of the sales amounts of four Electronics departments increased by the same amount as the sum of the sales amounts of four Apparel departments from 2018 to 2019.
- The total sales amounts of the four HomeDecor departments increased by Rs 70 Crores from 2018 to 2019.
- The sales amounts in the HomeDecor departments of Delhi and Bengaluru each increased by Rs 20 Crores from 2018 to 2019.
- The sales amounts in the Apparel departments of Delhi and Bengaluru each increased by the same amount in 2019 from 2018. The sales amounts in the Apparel departments of Mumbai and Kolkata also each increased by the same amount in 2019 from 2018.
- The sales amounts in the Apparel departments of Delhi, Kolkata and Bengaluru in 2019 followed an Arithmetic
What was the total sales amount, in Crore Rupees, in 2019 for the chain of departmental stores?
Answer the next 6 questions based on the information given below.
In an election several candidates contested for a constituency. In any constituency, the winning candidate was the one who polled the highest number of votes, the first runner up was the one who polled the second highest number of votes, the second runner up was the one who polled the third highest number of votes, and so on. There were no ties (in terms of number of votes polled by the candidates) in any of the constituencies in this election.
In an electoral system, a security deposit is the sum of money that a candidate is required to pay to the election commission before he or she is permitted to contest. Only the defeated candidates (i.e., one who is not the winning candidate) who fail to secure more than one sixth of the valid votes polled in the constituency, lose their security deposits.
The following table provides some incomplete information about votes polled in four constituencies: A, B, C and D, in this election.
 âââââââ
The following additional facts are known:
- The first runner up polled 10,000 more votes than the second runner up in constituency A.
- None of the candidates who contested in constituency C lost their security deposit. The difference in votes polled by any pair of candidates in this constituency was at least 10,000.
- The winning candidate in constituency D polled 5% of valid votes more than that of the first runner up. All the candidates who lost their security deposits while contesting for this constituency, put together, polled 35% of the valid votes.
What is the percentage of votes polled in total by all the candidates who lost their security deposits while contesting for constituency A?
Answer the next 6 questions based on the information given below.
In an election several candidates contested for a constituency. In any constituency, the winning candidate was the one who polled the highest number of votes, the first runner up was the one who polled the second highest number of votes, the second runner up was the one who polled the third highest number of votes, and so on. There were no ties (in terms of number of votes polled by the candidates) in any of the constituencies in this election.
In an electoral system, a security deposit is the sum of money that a candidate is required to pay to the election commission before he or she is permitted to contest. Only the defeated candidates (i.e., one who is not the winning candidate) who fail to secure more than one sixth of the valid votes polled in the constituency, lose their security deposits.
The following table provides some incomplete information about votes polled in four constituencies: A, B, C and D, in this election.
âââââââ
The following additional facts are known:
- The first runner up polled 10,000 more votes than the second runner up in constituency A.
- None of the candidates who contested in constituency C lost their security deposit. The difference in votes polled by any pair of candidates in this constituency was at least 10,000.
- The winning candidate in constituency D polled 5% of valid votes more than that of the first runner up. All the candidates who lost their security deposits while contesting for this constituency, put together, polled 35% of the valid votes.
How many candidates who contested in constituency B lost their security deposit?
Answer the next 6 questions based on the information given below.
In an election several candidates contested for a constituency. In any constituency, the winning candidate was the one who polled the highest number of votes, the first runner up was the one who polled the second highest number of votes, the second runner up was the one who polled the third highest number of votes, and so on. There were no ties (in terms of number of votes polled by the candidates) in any of the constituencies in this election.
In an electoral system, a security deposit is the sum of money that a candidate is required to pay to the election commission before he or she is permitted to contest. Only the defeated candidates (i.e., one who is not the winning candidate) who fail to secure more than one sixth of the valid votes polled in the constituency, lose their security deposits.
The following table provides some incomplete information about votes polled in four constituencies: A, B, C and D, in this election.
âââââââ
The following additional facts are known:
- The first runner up polled 10,000 more votes than the second runner up in constituency A.
- None of the candidates who contested in constituency C lost their security deposit. The difference in votes polled by any pair of candidates in this constituency was at least 10,000.
- The winning candidate in constituency D polled 5% of valid votes more than that of the first runner up. All the candidates who lost their security deposits while contesting for this constituency, put together, polled 35% of the valid votes.
What BEST can be concluded about the number of votes polled by the winning candidate in constituency C?
Answer the next 6 questions based on the information given below.
In an election several candidates contested for a constituency. In any constituency, the winning candidate was the one who polled the highest number of votes, the first runner up was the one who polled the second highest number of votes, the second runner up was the one who polled the third highest number of votes, and so on. There were no ties (in terms of number of votes polled by the candidates) in any of the constituencies in this election.
In an electoral system, a security deposit is the sum of money that a candidate is required to pay to the election commission before he or she is permitted to contest. Only the defeated candidates (i.e., one who is not the winning candidate) who fail to secure more than one sixth of the valid votes polled in the constituency, lose their security deposits.
The following table provides some incomplete information about votes polled in four constituencies: A, B, C and D, in this election.
âââââââ
The following additional facts are known:
- The first runner up polled 10,000 more votes than the second runner up in constituency A.
- None of the candidates who contested in constituency C lost their security deposit. The difference in votes polled by any pair of candidates in this constituency was at least 10,000.
- The winning candidate in constituency D polled 5% of valid votes more than that of the first runner up. All the candidates who lost their security deposits while contesting for this constituency, put together, polled 35% of the valid votes.
What was the number of valid votes polled in constituency D?
Answer the next 6 questions based on the information given below.
In an election several candidates contested for a constituency. In any constituency, the winning candidate was the one who polled the highest number of votes, the first runner up was the one who polled the second highest number of votes, the second runner up was the one who polled the third highest number of votes, and so on. There were no ties (in terms of number of votes polled by the candidates) in any of the constituencies in this election.
In an electoral system, a security deposit is the sum of money that a candidate is required to pay to the election commission before he or she is permitted to contest. Only the defeated candidates (i.e., one who is not the winning candidate) who fail to secure more than one sixth of the valid votes polled in the constituency, lose their security deposits.
The following table provides some incomplete information about votes polled in four constituencies: A, B, C and D, in this election.
âââââââ
The following additional facts are known:
- The first runner up polled 10,000 more votes than the second runner up in constituency A.
- None of the candidates who contested in constituency C lost their security deposit. The difference in votes polled by any pair of candidates in this constituency was at least 10,000.
- The winning candidate in constituency D polled 5% of valid votes more than that of the first runner up. All the candidates who lost their security deposits while contesting for this constituency, put together, polled 35% of the valid votes.
The winning margin of a constituency is defined as the difference of votes polled by the winner and that of the first runner up. Which of the following CANNOT be the list of constituencies, in increasing order of winning margin?
Answer the next 6 questions based on the information given below.
In an election several candidates contested for a constituency. In any constituency, the winning candidate was the one who polled the highest number of votes, the first runner up was the one who polled the second highest number of votes, the second runner up was the one who polled the third highest number of votes, and so on. There were no ties (in terms of number of votes polled by the candidates) in any of the constituencies in this election.
In an electoral system, a security deposit is the sum of money that a candidate is required to pay to the election commission before he or she is permitted to contest. Only the defeated candidates (i.e., one who is not the winning candidate) who fail to secure more than one sixth of the valid votes polled in the constituency, lose their security deposits.
The following table provides some incomplete information about votes polled in four constituencies: A, B, C and D, in this election.
âââââââ
The following additional facts are known:
- The first runner up polled 10,000 more votes than the second runner up in constituency A.
- None of the candidates who contested in constituency C lost their security deposit. The difference in votes polled by any pair of candidates in this constituency was at least 10,000.
- The winning candidate in constituency D polled 5% of valid votes more than that of the first runner up. All the candidates who lost their security deposits while contesting for this constituency, put together, polled 35% of the valid votes.
For all the four constituencies taken together, what was the approximate number of votes polled by all the candidates who lost their security deposit expressed as a percentage of the total valid votes from these four constituencies?
Answer the following question based on the information given below.
The Ministry of Home Affairs is analysing crimes committed by foreigners in different states and union territories (UT) of India. All cases refer to the ones registered against foreigners in 2016.
The number of cases – classified into three categories: IPC crimes, SLL crimes and other crimes – for nine states/UTs are shown in the figure below. These nine belong to the top ten states/UTs in terms of the total number of cases registered. The remaining state (among top ten) is West Bengal, where all the 520 cases registered were SLL crimes.

The table below shows the ranks of the ten states/UTs mentioned above among ALL states/UTs of India in terms of the number of cases registered in each of the three category of crimes. A state/UT is given rank r for a category of crimes if there are (r−1) states/UTs having a larger number of cases registered in that category of crimes. For example, if two states have the same number of cases in a category, and exactly three other states/UTs have larger numbers of cases registered in the same category, then both the states are given rank 4 in that category. Missing ranks in the table are denoted by *.
 âââââââ
What is the rank of Kerala in the ‘IPC crimes’ category?
Answer the following question based on the information given below.
The Ministry of Home Affairs is analysing crimes committed by foreigners in different states and union territories (UT) of India. All cases refer to the ones registered against foreigners in 2016.
The number of cases – classified into three categories: IPC crimes, SLL crimes and other crimes – for nine states/UTs are shown in the figure below. These nine belong to the top ten states/UTs in terms of the total number of cases registered. The remaining state (among top ten) is West Bengal, where all the 520 cases registered were SLL crimes.
The table below shows the ranks of the ten states/UTs mentioned above among ALL states/UTs of India in terms of the number of cases registered in each of the three category of crimes. A state/UT is given rank r for a category of crimes if there are (r−1) states/UTs having a larger number of cases registered in that category of crimes. For example, if two states have the same number of cases in a category, and exactly three other states/UTs have larger numbers of cases registered in the same category, then both the states are given rank 4 in that category. Missing ranks in the table are denoted by *.
âââââââ
In the two states where the highest total number of cases are registered, the ratio of the total number of cases in IPC crimes to the total number in SLL crimes is closest to ?
Answer the following question based on the information given below.
The Ministry of Home Affairs is analysing crimes committed by foreigners in different states and union territories (UT) of India. All cases refer to the ones registered against foreigners in 2016.
The number of cases – classified into three categories: IPC crimes, SLL crimes and other crimes – for nine states/UTs are shown in the figure below. These nine belong to the top ten states/UTs in terms of the total number of cases registered. The remaining state (among top ten) is West Bengal, where all the 520 cases registered were SLL crimes.
The table below shows the ranks of the ten states/UTs mentioned above among ALL states/UTs of India in terms of the number of cases registered in each of the three category of crimes. A state/UT is given rank r for a category of crimes if there are (r−1) states/UTs having a larger number of cases registered in that category of crimes. For example, if two states have the same number of cases in a category, and exactly three other states/UTs have larger numbers of cases registered in the same category, then both the states are given rank 4 in that category. Missing ranks in the table are denoted by *.
âââââââ
Which of the following is DEFINITELY true about the ranks of states/UT in the ‘other crimes’ category?
i. Tamil Nadu: 2
ii. Puducherry: 3
Answer the following question based on the information given below.
The Ministry of Home Affairs is analysing crimes committed by foreigners in different states and union territories (UT) of India. All cases refer to the ones registered against foreigners in 2016.
The number of cases – classified into three categories: IPC crimes, SLL crimes and other crimes – for nine states/UTs are shown in the figure below. These nine belong to the top ten states/UTs in terms of the total number of cases registered. The remaining state (among top ten) is West Bengal, where all the 520 cases registered were SLL crimes.
The table below shows the ranks of the ten states/UTs mentioned above among ALL states/UTs of India in terms of the number of cases registered in each of the three category of crimes. A state/UT is given rank r for a category of crimes if there are (r−1) states/UTs having a larger number of cases registered in that category of crimes. For example, if two states have the same number of cases in a category, and exactly three other states/UTs have larger numbers of cases registered in the same category, then both the states are given rank 4 in that category. Missing ranks in the table are denoted by *.
âââââââ
What is the sum of the ranks of Delhi in the three categories of crimes?
Answer the following question based on the information given below.
Five vendors are being considered for a service. The evaluation committee evaluated each vendor on six aspects – Cost, Customer Service, Features, Quality, Reach, and Reliability. Each of these evaluations are on a scale of 0 (worst) to 100 (perfect). The evaluation scores on these aspects are shown in the radar chart. For example, Vendor 1 obtains a score of 52 on Reliability, Vendor 2 obtains a score of 45 on Features and Vendor 3 obtains a score of 90 on Cost.

On which aspect is the median score of the five vendors the least?
Answer the following question based on the information given below.
Five vendors are being considered for a service. The evaluation committee evaluated each vendor on six aspects – Cost, Customer Service, Features, Quality, Reach, and Reliability. Each of these evaluations are on a scale of 0 (worst) to 100 (perfect). The evaluation scores on these aspects are shown in the radar chart. For example, Vendor 1 obtains a score of 52 on Reliability, Vendor 2 obtains a score of 45 on Features and Vendor 3 obtains a score of 90 on Cost.
A vendor's final score is the average of their scores on all six aspects. Which vendor has the highest final score?
Answer the following question based on the information given below.
Five vendors are being considered for a service. The evaluation committee evaluated each vendor on six aspects – Cost, Customer Service, Features, Quality, Reach, and Reliability. Each of these evaluations are on a scale of 0 (worst) to 100 (perfect). The evaluation scores on these aspects are shown in the radar chart. For example, Vendor 1 obtains a score of 52 on Reliability, Vendor 2 obtains a score of 45 on Features and Vendor 3 obtains a score of 90 on Cost.
List of all the vendors who are among the top two scorers on the maximum number of aspects is:
Answer the following question based on the information given below.
Five vendors are being considered for a service. The evaluation committee evaluated each vendor on six aspects – Cost, Customer Service, Features, Quality, Reach, and Reliability. Each of these evaluations are on a scale of 0 (worst) to 100 (perfect). The evaluation scores on these aspects are shown in the radar chart. For example, Vendor 1 obtains a score of 52 on Reliability, Vendor 2 obtains a score of 45 on Features and Vendor 3 obtains a score of 90 on Cost.
List of all the vendors who are among the top three vendors on all six aspects is:
Answer the following questions based on the information given below.
To compare the rainfall data, India Meteorological Department (IMD) calculated the Long Period Average (LPA) of rainfall during period June-August for each of the 16 states. The figure given below shows the actual rainfall (measured in mm) during June-August, 2019 and the percentage deviations from LPA of respective states in 2018. Each state along with its actual rainfall is presented in the figure.
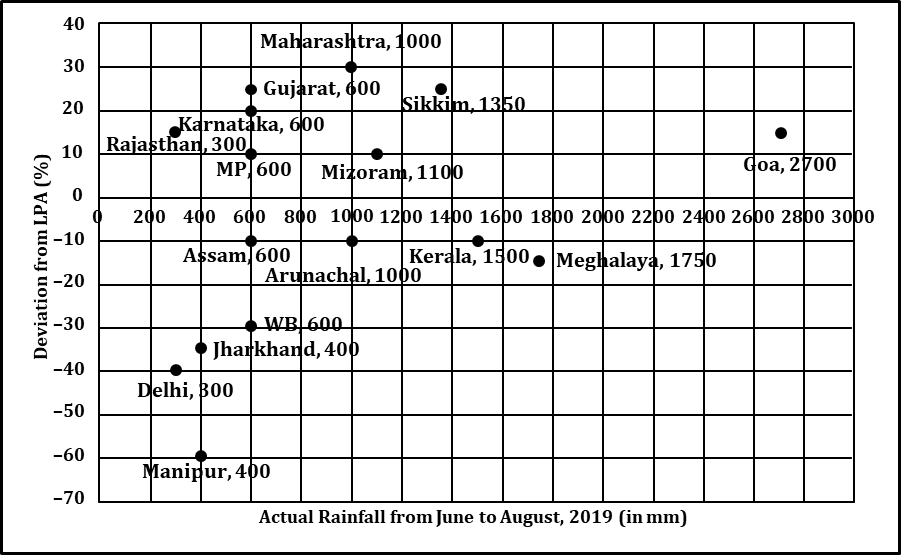
If a ‘Heavy Monsoon State’ is defined as a state with actual rainfall from June-August, 2019 of 900 mm or more, then approximately what percentage of ‘Heavy Monsoon States’ have a negative deviation from respective LPAs in 2019?
Answer the following questions based on the information given below.
To compare the rainfall data, India Meteorological Department (IMD) calculated the Long Period Average (LPA) of rainfall during period June-August for each of the 16 states. The figure given below shows the actual rainfall (measured in mm) during June-August, 2019 and the percentage deviations from LPA of respective states in 2018. Each state along with its actual rainfall is presented in the figure.
If a ‘Low Monsoon State’ is defined as a state with actual rainfall from June-August, 2019 of 750 mm or less, then what is the median ‘deviation from LPA’ (as defined in the Y-axis of the figure) of ‘Low Monsoon States’?
Answer the following questions based on the information given below.
To compare the rainfall data, India Meteorological Department (IMD) calculated the Long Period Average (LPA) of rainfall during period June-August for each of the 16 states. The figure given below shows the actual rainfall (measured in mm) during June-August, 2019 and the percentage deviations from LPA of respective states in 2018. Each state along with its actual rainfall is presented in the figure.
What is the average rainfall of all states that have actual rainfall of 600 mm or less in 2019 and have a negative deviation from LPA?
Answer the following questions based on the information given below.
To compare the rainfall data, India Meteorological Department (IMD) calculated the Long Period Average (LPA) of rainfall during period June-August for each of the 16 states. The figure given below shows the actual rainfall (measured in mm) during June-August, 2019 and the percentage deviations from LPA of respective states in 2018. Each state along with its actual rainfall is presented in the figure.
The LPA of a state for a year is defined as the average rainfall in the preceding 10 years considering the period of June-August. For example, LPA in 2018 is the average rainfall during 2009-2018 and LPA in 2019 is the average rainfall during 2010-2019. It is also observed that the actual rainfall in Gujarat in 2019 is 20% more than the rainfall in 2009. The LPA of Gujarat in 2019 is closest to
Answer the following questions based on the information given below.
A large store has only three departments, Clothing, Produce, and Electronics. The following figure shows the percentages of revenue and cost from the three departments for the years 2016, 2017 and 2018. The dotted lines depict percentage levels. So for example, in 2016, 50% of store's revenue came from its Electronics department while 40% of its costs were incurred in the Produce department.

In this setup, Profit is computed as (Revenue – Cost) and Percentage Profit as Profit/Cost × 100%.
It is known that
- The percentage profit for the store in 2016 was 100%.
- The store’s revenue doubled from 2016 to 2017, and its cost doubled from 2016 to 2018.
- There was no profit from the Electronics department in 2017.
- In 2018, the revenue from the Clothing department was the same as the cost incurred in the Produce department.
What was the ratio of revenue generated from the Produce department in 2017 to that in 2018?
Answer the following questions based on the information given below.
A large store has only three departments, Clothing, Produce, and Electronics. The following figure shows the percentages of revenue and cost from the three departments for the years 2016, 2017 and 2018. The dotted lines depict percentage levels. So for example, in 2016, 50% of store's revenue came from its Electronics department while 40% of its costs were incurred in the Produce department.
In this setup, Profit is computed as (Revenue – Cost) and Percentage Profit as Profit/Cost × 100%.
It is known that
- The percentage profit for the store in 2016 was 100%.
- The store’s revenue doubled from 2016 to 2017, and its cost doubled from 2016 to 2018.
- There was no profit from the Electronics department in 2017.
- In 2018, the revenue from the Clothing department was the same as the cost incurred in the Produce department.
What was the percentage profit of the store in 2018?
Answer the following questions based on the information given below.
A large store has only three departments, Clothing, Produce, and Electronics. The following figure shows the percentages of revenue and cost from the three departments for the years 2016, 2017 and 2018. The dotted lines depict percentage levels. So for example, in 2016, 50% of store's revenue came from its Electronics department while 40% of its costs were incurred in the Produce department.
In this setup, Profit is computed as (Revenue – Cost) and Percentage Profit as Profit/Cost × 100%.
It is known that
- The percentage profit for the store in 2016 was 100%.
- The store’s revenue doubled from 2016 to 2017, and its cost doubled from 2016 to 2018.
- There was no profit from the Electronics department in 2017.
- In 2018, the revenue from the Clothing department was the same as the cost incurred in the Produce department.
What percentage of the total profits for the store in 2016 was from the Electronics department?
Answer the following questions based on the information given below.
A large store has only three departments, Clothing, Produce, and Electronics. The following figure shows the percentages of revenue and cost from the three departments for the years 2016, 2017 and 2018. The dotted lines depict percentage levels. So for example, in 2016, 50% of store's revenue came from its Electronics department while 40% of its costs were incurred in the Produce department.
In this setup, Profit is computed as (Revenue – Cost) and Percentage Profit as Profit/Cost × 100%.
It is known that
- The percentage profit for the store in 2016 was 100%.
- The store’s revenue doubled from 2016 to 2017, and its cost doubled from 2016 to 2018.
- There was no profit from the Electronics department in 2017.
- In 2018, the revenue from the Clothing department was the same as the cost incurred in the Produce department.
What was the approximate difference in profit percentages of the store in 2017 and 2018?
Answer the following questions based on the information given below.
Students in a college are discussing two proposals –
A: a proposal by the authorities to introduce dress code on campus, and
B: a proposal by the students to allow multinational food franchises to set up outlets on college campus.
A student does not necessarily support either of the two proposals.
In an upcoming election for student union president, there are two candidates in fray: Sunita and Ragini. Every student prefers one of the two candidates.
A survey was conducted among the students by picking a sample of 500 students. The following information was noted from this survey.
- 250 students supported proposal A and 250 students supported proposal B.
- Among the 200 students who preferred Sunita as student union president, 80% supported proposal A.
- Among those who preferred Ragini, 30% supported proposal A.
- 20% of those who supported proposal B preferred Sunita.
- 40% of those who did not support proposal B preferred Ragini.
- Every student who preferred Sunita and supported proposal B also supported proposal A.
- Among those who preferred Ragini, 20% did not support any of the proposals.
What percentage of the students surveyed who supported both proposals A and B preferred Sunita as student union president?
Answer the following questions based on the information given below.
Students in a college are discussing two proposals –
A: a proposal by the authorities to introduce dress code on campus, and
B: a proposal by the students to allow multinational food franchises to set up outlets on college campus.
A student does not necessarily support either of the two proposals.
In an upcoming election for student union president, there are two candidates in fray: Sunita and Ragini. Every student prefers one of the two candidates.
A survey was conducted among the students by picking a sample of 500 students. The following information was noted from this survey.
- 250 students supported proposal A and 250 students supported proposal B.
- Among the 200 students who preferred Sunita as student union president, 80% supported proposal A.
- Among those who preferred Ragini, 30% supported proposal A.
- 20% of those who supported proposal B preferred Sunita.
- 40% of those who did not support proposal B preferred Ragini.
- Every student who preferred Sunita and supported proposal B also supported proposal A.
- Among those who preferred Ragini, 20% did not support any of the proposals.
Among the students surveyed who supported proposal A, what percentage preferred Sunita for student union president?
Answer the following questions based on the information given below.
Students in a college are discussing two proposals –
A: a proposal by the authorities to introduce dress code on campus, and
B: a proposal by the students to allow multinational food franchises to set up outlets on college campus.
A student does not necessarily support either of the two proposals.
In an upcoming election for student union president, there are two candidates in fray: Sunita and Ragini. Every student prefers one of the two candidates.
A survey was conducted among the students by picking a sample of 500 students. The following information was noted from this survey.
- 250 students supported proposal A and 250 students supported proposal B.
- Among the 200 students who preferred Sunita as student union president, 80% supported proposal A.
- Among those who preferred Ragini, 30% supported proposal A.
- 20% of those who supported proposal B preferred Sunita.
- 40% of those who did not support proposal B preferred Ragini.
- Every student who preferred Sunita and supported proposal B also supported proposal A.
- Among those who preferred Ragini, 20% did not support any of the proposals.
What percentage of the students surveyed who did not support proposal A preferred Ragini as student union president?
Answer the following questions based on the information given below.
Students in a college are discussing two proposals –
A: a proposal by the authorities to introduce dress code on campus, and
B: a proposal by the students to allow multinational food franchises to set up outlets on college campus.
A student does not necessarily support either of the two proposals.
In an upcoming election for student union president, there are two candidates in fray: Sunita and Ragini. Every student prefers one of the two candidates.
A survey was conducted among the students by picking a sample of 500 students. The following information was noted from this survey.
- 250 students supported proposal A and 250 students supported proposal B.
- Among the 200 students who preferred Sunita as student union president, 80% supported proposal A.
- Among those who preferred Ragini, 30% supported proposal A.
- 20% of those who supported proposal B preferred Sunita.
- 40% of those who did not support proposal B preferred Ragini.
- Every student who preferred Sunita and supported proposal B also supported proposal A.
- Among those who preferred Ragini, 20% did not support any of the proposals.
How many of the students surveyed supported proposal B, did not support proposal A and preferred Ragini as student union president?
Answer the following question based on the information given below.
The multi-layered pie-chart below shows the sales of LED television sets for a big retail electronics outlet during 2016 and 2017. The outer layer shows the monthly sales during this period, with each label showing the month followed by sales figure of that month. For some months, the sales figures are not given in the chart. The middle-layer shows quarter wise aggregate sales figures (in some cases, aggregate quarter-wise sales numbers are not given next to the quarter). The innermost layer shows annual sales. It is known that the sales figures during the three months of the second quarter (April, May, June) of 2016 form an arithmetic progression, as do the three monthly sales figures in the fourth quarter (October, November, December) of that year.

What is the percentage increase in sales in December 2017 as compared to the sales in December 2016?
Answer the following question based on the information given below.
The multi-layered pie-chart below shows the sales of LED television sets for a big retail electronics outlet during 2016 and 2017. The outer layer shows the monthly sales during this period, with each label showing the month followed by sales figure of that month. For some months, the sales figures are not given in the chart. The middle-layer shows quarter wise aggregate sales figures (in some cases, aggregate quarter-wise sales numbers are not given next to the quarter). The innermost layer shows annual sales. It is known that the sales figures during the three months of the second quarter (April, May, June) of 2016 form an arithmetic progression, as do the three monthly sales figures in the fourth quarter (October, November, December) of that year.
In which quarter of 2017 was the percentage increase in sales from the same quarter of 2016 the highest?
Answer the following question based on the information given below.
The multi-layered pie-chart below shows the sales of LED television sets for a big retail electronics outlet during 2016 and 2017. The outer layer shows the monthly sales during this period, with each label showing the month followed by sales figure of that month. For some months, the sales figures are not given in the chart. The middle-layer shows quarter wise aggregate sales figures (in some cases, aggregate quarter-wise sales numbers are not given next to the quarter). The innermost layer shows annual sales. It is known that the sales figures during the three months of the second quarter (April, May, June) of 2016 form an arithmetic progression, as do the three monthly sales figures in the fourth quarter (October, November, December) of that year.
During which quarter was the percentage decrease in sales from the previous quarter’s sales the highest?
Answer the following question based on the information given below.
The multi-layered pie-chart below shows the sales of LED television sets for a big retail electronics outlet during 2016 and 2017. The outer layer shows the monthly sales during this period, with each label showing the month followed by sales figure of that month. For some months, the sales figures are not given in the chart. The middle-layer shows quarter wise aggregate sales figures (in some cases, aggregate quarter-wise sales numbers are not given next to the quarter). The innermost layer shows annual sales. It is known that the sales figures during the three months of the second quarter (April, May, June) of 2016 form an arithmetic progression, as do the three monthly sales figures in the fourth quarter (October, November, December) of that year.
During which month was the percentage increase in sales from the previous month’s sales the highest?
Answer the following question based on the information given below.
An agency entrusted to accredit colleges looks at four parameters: faculty quality (F), reputation (R), placement quality (P), and infrastructure (I). The four parameters are used to arrive at an overall score, which the agency uses to give an accreditation to the colleges. In each parameter, there are five possible letter grades given, each carrying certain points: A
(50 points), B (40 points), C (30 points), D (20 points), and F (0 points). The overall score for a college is the weighted sum of the points scored in the four parameters. The weights of the parameters are 0.1, 0.2, 0.3 and 0.4 in some order, but the order is not disclosed. Accreditation is awarded based on the following scheme:
 âââââââ
Eight colleges apply for accreditation, and receive the following grades in the four parameters (F, R, P, and I):
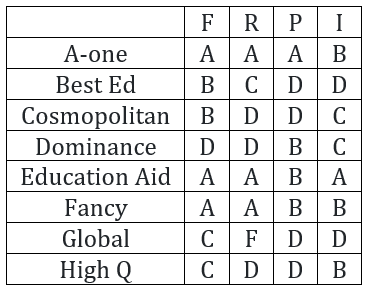 âââââââ
It is further known that in terms of overall scores:
- High Q is better than Best Ed;
- Best Ed is better than Cosmopolitan; and
- Education Aid is better than A-one.
What is the weight of the faculty quality parameter?
Answer the following question based on the information given below.
An agency entrusted to accredit colleges looks at four parameters: faculty quality (F), reputation (R), placement quality (P), and infrastructure (I). The four parameters are used to arrive at an overall score, which the agency uses to give an accreditation to the colleges. In each parameter, there are five possible letter grades given, each carrying certain points: A
(50 points), B (40 points), C (30 points), D (20 points), and F (0 points). The overall score for a college is the weighted sum of the points scored in the four parameters. The weights of the parameters are 0.1, 0.2, 0.3 and 0.4 in some order, but the order is not disclosed. Accreditation is awarded based on the following scheme:
âââââââ
Eight colleges apply for accreditation, and receive the following grades in the four parameters (F, R, P, and I):
âââââââ
It is further known that in terms of overall scores:
- High Q is better than Best Ed;
- Best Ed is better than Cosmopolitan; and
- Education Aid is better than A-one.
How many colleges receive the accreditation of AAA?
Answer the following question based on the information given below.
An agency entrusted to accredit colleges looks at four parameters: faculty quality (F), reputation (R), placement quality (P), and infrastructure (I). The four parameters are used to arrive at an overall score, which the agency uses to give an accreditation to the colleges. In each parameter, there are five possible letter grades given, each carrying certain points: A
(50 points), B (40 points), C (30 points), D (20 points), and F (0 points). The overall score for a college is the weighted sum of the points scored in the four parameters. The weights of the parameters are 0.1, 0.2, 0.3 and 0.4 in some order, but the order is not disclosed. Accreditation is awarded based on the following scheme:
âââââââ
Eight colleges apply for accreditation, and receive the following grades in the four parameters (F, R, P, and I):
âââââââ
It is further known that in terms of overall scores:
- High Q is better than Best Ed;
- Best Ed is better than Cosmopolitan; and
- Education Aid is better than A-one.
What is the highest overall score among the eight colleges?
Answer the following question based on the information given below.
An agency entrusted to accredit colleges looks at four parameters: faculty quality (F), reputation (R), placement quality (P), and infrastructure (I). The four parameters are used to arrive at an overall score, which the agency uses to give an accreditation to the colleges. In each parameter, there are five possible letter grades given, each carrying certain points: A
(50 points), B (40 points), C (30 points), D (20 points), and F (0 points). The overall score for a college is the weighted sum of the points scored in the four parameters. The weights of the parameters are 0.1, 0.2, 0.3 and 0.4 in some order, but the order is not disclosed. Accreditation is awarded based on the following scheme:
âââââââ
Eight colleges apply for accreditation, and receive the following grades in the four parameters (F, R, P, and I):
âââââââ
It is further known that in terms of overall scores:
- High Q is better than Best Ed;
- Best Ed is better than Cosmopolitan; and
- Education Aid is better than A-one.
How many colleges have overall scores between 31 and 40, both inclusive?
Answer the following question based on the information given below.
Each of the 23 boxes in the picture below represents a product manufactured by one of the following three companies: Alfa, Bravo and Charlie. The area of a box is proportional to the revenue from the corresponding product, while its centre represents the Product popularity and Market potential scores of the product (out of 20). The shadings of some of the boxes have got erased.

The companies classified their products into four categories based on a combination of scores (out of 20) on the two parameters – Product popularity and Market potential as given below:
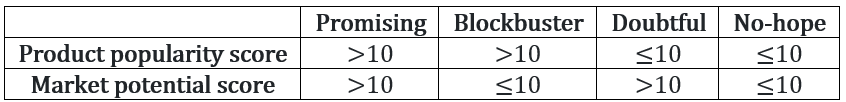 âââââââ
The following facts are known:
- Alfa and Bravo had the same number of products in the Blockbuster category.
- Charlie had more products than Bravo but fewer products than Alfa in the No-hope category.
- Each company had an equal number of products in the Promising category.
- Charlie did not have any product in the Doubtful category, while Alfa had one product more than Bravo in this category.
- Bravo had a higher revenue than Alfa from products in the Doubtful category.
- Charlie had a higher revenue than Bravo from products in the Blockbuster category.
- Bravo and Charlie had the same revenue from products in the No-hope category.
- Alfa and Charlie had the same total revenue considering all products.
Considering all companies' products, which product category had the highest revenue?
Answer the following question based on the information given below.
Each of the 23 boxes in the picture below represents a product manufactured by one of the following three companies: Alfa, Bravo and Charlie. The area of a box is proportional to the revenue from the corresponding product, while its centre represents the Product popularity and Market potential scores of the product (out of 20). The shadings of some of the boxes have got erased.
The companies classified their products into four categories based on a combination of scores (out of 20) on the two parameters – Product popularity and Market potential as given below:
âââââââ
The following facts are known:
- Alfa and Bravo had the same number of products in the Blockbuster category.
- Charlie had more products than Bravo but fewer products than Alfa in the No-hope category.
- Each company had an equal number of products in the Promising category.
- Charlie did not have any product in the Doubtful category, while Alfa had one product more than Bravo in this category.
- Bravo had a higher revenue than Alfa from products in the Doubtful category.
- Charlie had a higher revenue than Bravo from products in the Blockbuster category.
- Bravo and Charlie had the same revenue from products in the No-hope category.
- Alfa and Charlie had the same total revenue considering all products.
Which of the following is the correct sequence of numbers of products Bravo had in No-hope, Doubtful, Promising and Blockbuster categories respectively?
Answer the following question based on the information given below.
Each of the 23 boxes in the picture below represents a product manufactured by one of the following three companies: Alfa, Bravo and Charlie. The area of a box is proportional to the revenue from the corresponding product, while its centre represents the Product popularity and Market potential scores of the product (out of 20). The shadings of some of the boxes have got erased.
The companies classified their products into four categories based on a combination of scores (out of 20) on the two parameters – Product popularity and Market potential as given below:
âââââââ
The following facts are known:
- Alfa and Bravo had the same number of products in the Blockbuster category.
- Charlie had more products than Bravo but fewer products than Alfa in the No-hope category.
- Each company had an equal number of products in the Promising category.
- Charlie did not have any product in the Doubtful category, while Alfa had one product more than Bravo in this category.
- Bravo had a higher revenue than Alfa from products in the Doubtful category.
- Charlie had a higher revenue than Bravo from products in the Blockbuster category.
- Bravo and Charlie had the same revenue from products in the No-hope category.
- Alfa and Charlie had the same total revenue considering all products.
Which of the following statements is NOT correct?
Answer the following question based on the information given below.
Each of the 23 boxes in the picture below represents a product manufactured by one of the following three companies: Alfa, Bravo and Charlie. The area of a box is proportional to the revenue from the corresponding product, while its centre represents the Product popularity and Market potential scores of the product (out of 20). The shadings of some of the boxes have got erased.
The companies classified their products into four categories based on a combination of scores (out of 20) on the two parameters – Product popularity and Market potential as given below:
âââââââ
The following facts are known:
- Alfa and Bravo had the same number of products in the Blockbuster category.
- Charlie had more products than Bravo but fewer products than Alfa in the No-hope category.
- Each company had an equal number of products in the Promising category.
- Charlie did not have any product in the Doubtful category, while Alfa had one product more than Bravo in this category.
- Bravo had a higher revenue than Alfa from products in the Doubtful category.
- Charlie had a higher revenue than Bravo from products in the Blockbuster category.
- Bravo and Charlie had the same revenue from products in the No-hope category.
- Alfa and Charlie had the same total revenue considering all products.
If the smallest box on the grid is equivalent to revenue of Rs.1 crore, then what approximately was the total revenue of Bravo in Rs. crore?
Answer the following question based on the information given below.
There are only four brands of entry level smartphones called Azra, Bysi, Cxqi, and Dipq in a country. Details about their market share, unit selling price, and profitability (defined as the profit as a percentage of the revenue) for the year 2016 are given in the table below:
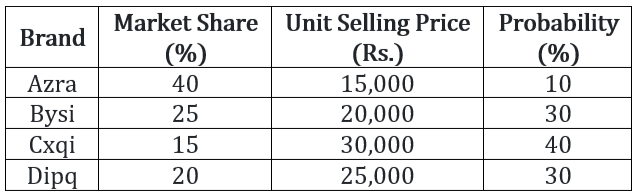 âââââââ
In 2017, sales volume of entry level smartphones grew by 40% as compared to that in 2016. Cxqi offered a 40% discount on its unit selling price in 2017, which resulted in a 15% increase in its market share. Each of the other three brands lost 5% market share. However, the profitability of Cxqi came down to half of its value in 2016. The unit selling prices of the other three brands and their profitability values remained the same in 2017 asthey were in 2016.
The brand that had the highest revenue in 2016 is:
Answer the following question based on the information given below.
There are only four brands of entry level smartphones called Azra, Bysi, Cxqi, and Dipq in a country. Details about their market share, unit selling price, and profitability (defined as the profit as a percentage of the revenue) for the year 2016 are given in the table below:
âââââââ
In 2017, sales volume of entry level smartphones grew by 40% as compared to that in 2016. Cxqi offered a 40% discount on its unit selling price in 2017, which resulted in a 15% increase in its market share. Each of the other three brands lost 5% market share. However, the profitability of Cxqi came down to half of its value in 2016. The unit selling prices of the other three brands and their profitability values remained the same in 2017 asthey were in 2016.
The brand that had the highest profit in 2016 is:
Answer the following question based on the information given below.
There are only four brands of entry level smartphones called Azra, Bysi, Cxqi, and Dipq in a country. Details about their market share, unit selling price, and profitability (defined as the profit as a percentage of the revenue) for the year 2016 are given in the table below:
âââââââ
In 2017, sales volume of entry level smartphones grew by 40% as compared to that in 2016. Cxqi offered a 40% discount on its unit selling price in 2017, which resulted in a 15% increase in its market share. Each of the other three brands lost 5% market share. However, the profitability of Cxqi came down to half of its value in 2016. The unit selling prices of the other three brands and their profitability values remained the same in 2017 asthey were in 2016.
The brand that had the highest profit in 2017 is:
Answer the following question based on the information given below.
There are only four brands of entry level smartphones called Azra, Bysi, Cxqi, and Dipq in a country. Details about their market share, unit selling price, and profitability (defined as the profit as a percentage of the revenue) for the year 2016 are given in the table below:
âââââââ
In 2017, sales volume of entry level smartphones grew by 40% as compared to that in 2016. Cxqi offered a 40% discount on its unit selling price in 2017, which resulted in a 15% increase in its market share. Each of the other three brands lost 5% market share. However, the profitability of Cxqi came down to half of its value in 2016. The unit selling prices of the other three brands and their profitability values remained the same in 2017 asthey were in 2016.
The complete list of brands whose profits went up in 2017 from 2016 is:
Answer the following question based on the information given below.
A study to look at the early learning of rural kids was carried out in a number of villages spanning three states, chosen from the North East (NE), the West (W) and the South (S). 50 four-year old kids each were sampled from each of the 150 villages from NE, 250 villages from W and 200 villages from S. It was found that of the 30000 surveyed kids 55% studied in primary schools run by government (G), 37% in private schools (P) while the remaining 8% did not go to school (O).
The kids surveyed were further divided into two groups based on whether their mothers dropped out of school before completing primary education or not. The table below gives the number of kids in different types of schools for mothers who dropped out of school before completing primary education:
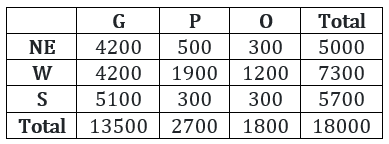 âââââââ
It is also known that:
- In S, 60% of the surveyed kids were in G. Moreover, in S, all surveyed kids whose mothers had completed primary education were in school.
- In NE, among the O kids, 50% had mothers who had dropped out before completing primary education.
- The number of kids in G in NE was the same as the number of kids in G in W.
What percentage of kids from S were studying in P?
Answer the following question based on the information given below.
A study to look at the early learning of rural kids was carried out in a number of villages spanning three states, chosen from the North East (NE), the West (W) and the South (S). 50 four-year old kids each were sampled from each of the 150 villages from NE, 250 villages from W and 200 villages from S. It was found that of the 30000 surveyed kids 55% studied in primary schools run by government (G), 37% in private schools (P) while the remaining 8% did not go to school (O).
The kids surveyed were further divided into two groups based on whether their mothers dropped out of school before completing primary education or not. The table below gives the number of kids in different types of schools for mothers who dropped out of school before completing primary education:
âââââââ
It is also known that:
- In S, 60% of the surveyed kids were in G. Moreover, in S, all surveyed kids whose mothers had completed primary education were in school.
- In NE, among the O kids, 50% had mothers who had dropped out before completing primary education.
- The number of kids in G in NE was the same as the number of kids in G in W.
Among the kids in W whose mothers had complete primary education, how many were not in school?
Answer the following question based on the information given below.
A study to look at the early learning of rural kids was carried out in a number of villages spanning three states, chosen from the North East (NE), the West (W) and the South (S). 50 four-year old kids each were sampled from each of the 150 villages from NE, 250 villages from W and 200 villages from S. It was found that of the 30000 surveyed kids 55% studied in primary schools run by government (G), 37% in private schools (P) while the remaining 8% did not go to school (O).
The kids surveyed were further divided into two groups based on whether their mothers dropped out of school before completing primary education or not. The table below gives the number of kids in different types of schools for mothers who dropped out of school before completing primary education:
âââââââ
It is also known that:
- In S, 60% of the surveyed kids were in G. Moreover, in S, all surveyed kids whose mothers had completed primary education were in school.
- In NE, among the O kids, 50% had mothers who had dropped out before completing primary education.
- The number of kids in G in NE was the same as the number of kids in G in W.
In a follow up survey of the same kids two years later, it was found that all the kids were now in school. Of the kids who were not in school earlier, in one region, 25% were in G now, whereas the rest were enrolled in P; in the second region, all such kids were in G now; while in the third region, 50% of such kids had now joined G while the rest had joined P. As a result, in all three regions put together, 50% of the kids who were earlier out of school had joined G. It was also seen that no surveyed kid had changed schools.
What number of the surveyed kids now were in G in W?
Answer the following question based on the information given below.
A study to look at the early learning of rural kids was carried out in a number of villages spanning three states, chosen from the North East (NE), the West (W) and the South (S). 50 four-year old kids each were sampled from each of the 150 villages from NE, 250 villages from W and 200 villages from S. It was found that of the 30000 surveyed kids 55% studied in primary schools run by government (G), 37% in private schools (P) while the remaining 8% did not go to school (O).
The kids surveyed were further divided into two groups based on whether their mothers dropped out of school before completing primary education or not. The table below gives the number of kids in different types of schools for mothers who dropped out of school before completing primary education:
âââââââ
It is also known that:
- In S, 60% of the surveyed kids were in G. Moreover, in S, all surveyed kids whose mothers had completed primary education were in school.
- In NE, among the O kids, 50% had mothers who had dropped out before completing primary education.
- The number of kids in G in NE was the same as the number of kids in G in W.
In a follow up survey of the same kids two years later, it was found that all the kids were now in school. Of the kids who were not in school earlier, in one region, 25% were in G now, whereas the rest were enrolled in P; in the second region, all such kids were in G now; while in the third region, 50% of such kids had now joined G while the rest had joined P. As a result, in all three regions put together, 50% of the kids who were earlier out of school had joined G. It was also seen that no surveyed kid had changed schools.
What percentage of the surveyed kids in S, whose mothers had dropped out before completing primary education, were in G now?
Answer the following question based on the information given below.
Simple Happiness index (SHI) of a country is computed on the basis of three parameters: social support (S), freedom to life choices (F) and corruption perception (C). Each of these three parameters is measured on a scale of 0 to 8 (integers only). A country is then categorized based on the total score obtained by summing the scores of all the three parameters, as shown in the following table:
 âââââââ
Following diagram depicts the frequency distribution of the scores in S, F and C of 10 countries – Amda, Benga, Calla, Delma, Eppa, Varsa, Wanna, Xanda, Yanga and Zooma:
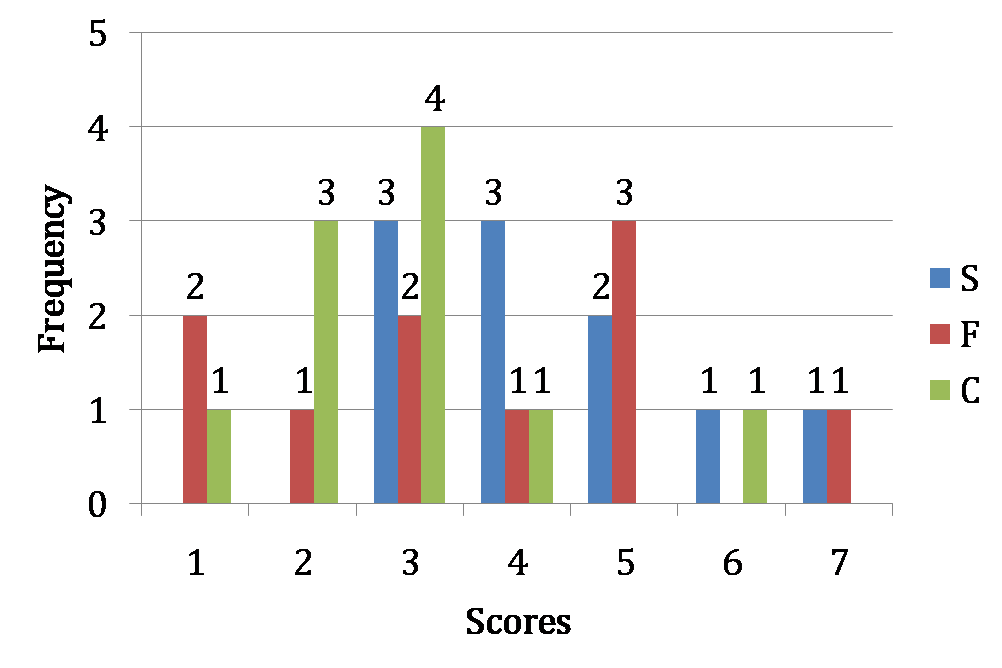
Further, the following are known:
- Amda and Calla jointly have the lowest total score, 7, with identical scores in all the three parameters.
- Zooma has a total score of 17.
- All the 3 countries, which are categorized as happy, have the highest score in exactly one parameter.
What is Amda's score in F?
Answer the following question based on the information given below.
Simple Happiness index (SHI) of a country is computed on the basis of three parameters: social support (S), freedom to life choices (F) and corruption perception (C). Each of these three parameters is measured on a scale of 0 to 8 (integers only). A country is then categorized based on the total score obtained by summing the scores of all the three parameters, as shown in the following table:
âââââââ
Following diagram depicts the frequency distribution of the scores in S, F and C of 10 countries – Amda, Benga, Calla, Delma, Eppa, Varsa, Wanna, Xanda, Yanga and Zooma:
Further, the following are known:
- Amda and Calla jointly have the lowest total score, 7, with identical scores in all the three parameters.
- Zooma has a total score of 17.
- All the 3 countries, which are categorized as happy, have the highest score in exactly one parameter.
What is Zooma’s score in S?
Answer the following question based on the information given below.
Simple Happiness index (SHI) of a country is computed on the basis of three parameters: social support (S), freedom to life choices (F) and corruption perception (C). Each of these three parameters is measured on a scale of 0 to 8 (integers only). A country is then categorized based on the total score obtained by summing the scores of all the three parameters, as shown in the following table:
âââââââ
Following diagram depicts the frequency distribution of the scores in S, F and C of 10 countries – Amda, Benga, Calla, Delma, Eppa, Varsa, Wanna, Xanda, Yanga and Zooma:
Further, the following are known:
- Amda and Calla jointly have the lowest total score, 7, with identical scores in all the three parameters.
- Zooma has a total score of 17.
- All the 3 countries, which are categorized as happy, have the highest score in exactly one parameter.
Benga and Delma, two countries categorized as happy, are tied with the same total score. What is the maximum score they can have?
Answer the following question based on the information given below.
Simple Happiness index (SHI) of a country is computed on the basis of three parameters: social support (S), freedom to life choices (F) and corruption perception (C). Each of these three parameters is measured on a scale of 0 to 8 (integers only). A country is then categorized based on the total score obtained by summing the scores of all the three parameters, as shown in the following table:
âââââââ
Following diagram depicts the frequency distribution of the scores in S, F and C of 10 countries – Amda, Benga, Calla, Delma, Eppa, Varsa, Wanna, Xanda, Yanga and Zooma:
Further, the following are known:
- Amda and Calla jointly have the lowest total score, 7, with identical scores in all the three parameters.
- Zooma has a total score of 17.
- All the 3 countries, which are categorized as happy, have the highest score in exactly one parameter.
If Benga scores 16 and Delma scores 15, then what is the maximum number of countries with a score of 13?
Answer the following question based on the information given below.
The bar chart below shows the revenue received, in million US Dollars (USD), from subscribers to a particular Internet service. The data covers the period 2003 to 2007 for the United States (US) and Europe. The bar chart also shows the estimated revenues from subscription to this service for the period 2008 to 2010.
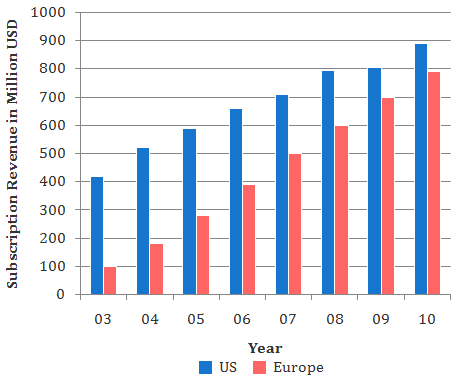
While the subscription in Europe has been growing steadily towards that of the US, the growth rate in Europe seems to be declining. Which of the following is closest to the percent change in growth rate of 2007 (over 2006) relative to the growth rate of 2005 (over 2004)?
Answer the following question based on the information given below.
The bar chart below shows the revenue received, in million US Dollars (USD), from subscribers to a particular Internet service. The data covers the period 2003 to 2007 for the United States (US) and Europe. The bar chart also shows the estimated revenues from subscription to this service for the period 2008 to 2010.
The difference between the estimated subscription in Europe in 2008 and what it would have been if it were computed using the percentage growth rate of 2007 (over 2006), is closest to:
Answer the following question based on the information given below.
The bar chart below shows the revenue received, in million US Dollars (USD), from subscribers to a particular Internet service. The data covers the period 2003 to 2007 for the United States (US) and Europe. The bar chart also shows the estimated revenues from subscription to this service for the period 2008 to 2010.
In 2003, sixty percent of subscribers in Europe were men. Given that woman subscribers increase at the rate of 10 percent per annum and men at the rate of 5 percent per annum, what is the approximate percentage growth of subscribers between 2003 and 2010 in Europe? The subscription prices are volatile and may change each year.
Answer the following question based on the information given below.
The bar chart below shows the revenue received, in million US Dollars (USD), from subscribers to a particular Internet service. The data covers the period 2003 to 2007 for the United States (US) and Europe. The bar chart also shows the estimated revenues from subscription to this service for the period 2008 to 2010.
Consider the annual percent change in the gap between subscription revenues in the US and Europe. What is the year in which the absolute value of this change is the highest?
Answer the following question based on the information given below.
Telecom operators get revenue from transfer of data and voice. Average revenue received from transfer of each unit of data is known as ARDT. In the diagram below, the revenue received from data transfer as percentage of total revenue received and the ARDT in US Dollars (USD) are given for various countries.

If the total revenue received is the same for the pairs of countries listed in the choices below, choose the pair that has approximately the same volume of data transfer.
Answer the following question based on the information given below.
Telecom operators get revenue from transfer of data and voice. Average revenue received from transfer of each unit of data is known as ARDT. In the diagram below, the revenue received from data transfer as percentage of total revenue received and the ARDT in US Dollars (USD) are given for various countries.
It was found that the volume of data transfer in India is the same as that of Singapore. Then which of the following statements are true?
Answer the following question based on the information given below.
Telecom operators get revenue from transfer of data and voice. Average revenue received from transfer of each unit of data is known as ARDT. In the diagram below, the revenue received from data transfer as percentage of total revenue received and the ARDT in US Dollars (USD) are given for various countries.
It is expected that by 2010, revenue from the data transfer as a percentage of total revenue will triple for India and double for Sweden. Assume that in 2010, the total revenue in India is twice that of Sweden and that the volume of data transfer is the same in both the countries. What is the percentage increase of ARDT in India if there is no change in ARDT in Sweden?
Answer the following question based on the information given below.
The proportion of male students and the proportion of vegetarian students in a school are given below. The school has a total of 800 students, 80% of whom are in the Secondary Section and rest equally divided between Class 11 and 12.
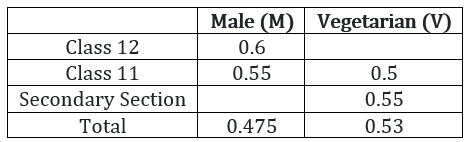 âââââââ
What is the percentage of vegetarian students in Class 12?
Answer the following question based on the information given below.
The proportion of male students and the proportion of vegetarian students in a school are given below. The school has a total of 800 students, 80% of whom are in the Secondary Section and rest equally divided between Class 11 and 12.
âââââââ
In Class 12, twenty five per cent of the vegetarians are male. What is the difference between the number of female vegetarians and male non-vegetarians?
Answer the following question based on the information given below.
The proportion of male students and the proportion of vegetarian students in a school are given below. The school has a total of 800 students, 80% of whom are in the Secondary Section and rest equally divided between Class 11 and 12.
âââââââ
What is the percentage of male students in the secondary section?
Answer the following question based on the information given below.
The proportion of male students and the proportion of vegetarian students in a school are given below. The school has a total of 800 students, 80% of whom are in the Secondary Section and rest equally divided between Class 11 and 12.
âââââââ
In the Secondary Section, 50% of the students are vegetarian males. Which of the following statements is correct?
Answer the following question based on the information given below.
The following table shows the break-up of actual costs incurred by a company in last five years (year 2002 to year 2006) to produce a particular product.
The production capacity of the company is 2000 units. The selling price for the year 2006 was Rs. 125 per unit. Some costs change almost in direct proportion to the change in volume of production, while others do not follow any obvious pattern of change with respect to the volume of production and hence are considered fixed. Using the information provided for the year 2006 as the basis for projecting the figures for the year 2007, answer the following questions.
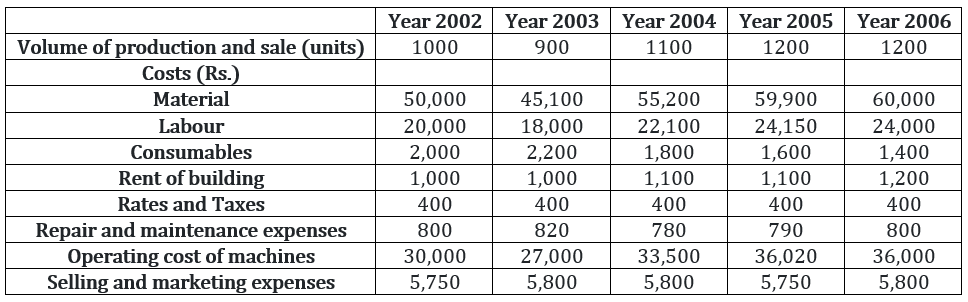 âââââââ
What is the approximate cost per unit in rupees, if the company produces and sells 1400 units in the year 2007?
Answer the following question based on the information given below.
The following table shows the break-up of actual costs incurred by a company in last five years (year 2002 to year 2006) to produce a particular product.
The production capacity of the company is 2000 units. The selling price for the year 2006 was Rs. 125 per unit. Some costs change almost in direct proportion to the change in volume of production, while others do not follow any obvious pattern of change with respect to the volume of production and hence are considered fixed. Using the information provided for the year 2006 as the basis for projecting the figures for the year 2007, answer the following questions.
âââââââ
What is the minimum number of units that the company needs to produce and sell to avoid any loss?
Answer the following question based on the information given below.
The following table shows the break-up of actual costs incurred by a company in last five years (year 2002 to year 2006) to produce a particular product.
The production capacity of the company is 2000 units. The selling price for the year 2006 was Rs. 125 per unit. Some costs change almost in direct proportion to the change in volume of production, while others do not follow any obvious pattern of change with respect to the volume of production and hence are considered fixed. Using the information provided for the year 2006 as the basis for projecting the figures for the year 2007, answer the following questions.
âââââââ
Given that the company cannot sell more than 1700 units, and it will have to reduce the price by Rs. 5 for all units, if it wants to sell more than 1400 units, what is the maximum profit, in rupees, that the company can earn?
Answer the following question based on the information given below.
The following table shows the break-up of actual costs incurred by a company in last five years (year 2002 to year 2006) to produce a particular product.
The production capacity of the company is 2000 units. The selling price for the year 2006 was Rs. 125 per unit. Some costs change almost in direct proportion to the change in volume of production, while others do not follow any obvious pattern of change with respect to the volume of production and hence are considered fixed. Using the information provided for the year 2006 as the basis for projecting the figures for the year 2007, answer the following questions.
âââââââ
If the company reduces the price by 5%, it can produce and sell as many units as it desires. How many units the company should produce to maximize its profit?
Answer the following question based on the information given below.
The table below shows the comparative costs, in US Dollars, of major surgeries in USA and a select few Asian countries.
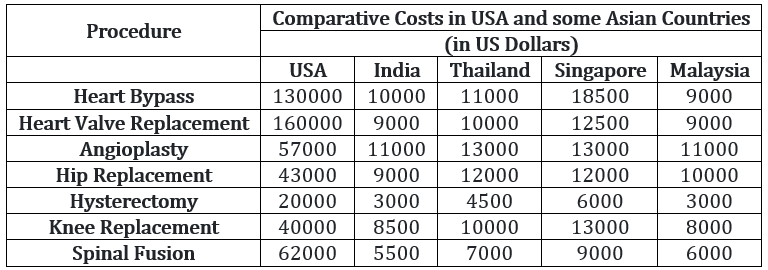 âââââââ
The equivalent of one US Dollar in the local currencies is given below.
 âââââââ
A consulting firm found that the quality of the health services were not the same in all the countries above. A poor quality of a surgery may have significant repercussions in future, resulting in more cost in correcting mistakes. The cost of poor quality of surgery is given in the table below.
 âââââââ
The rupee value increases to Rs. 35 for a US Dollar, and all other things including quality, remain the same. What is the approximate difference in cost, in US Dollars, between Singapore and India for a Spinal Fusion, taking this change into account?
Answer the following question based on the information given below.
The table below shows the comparative costs, in US Dollars, of major surgeries in USA and a select few Asian countries.
âââââââ
The equivalent of one US Dollar in the local currencies is given below.
âââââââ
A consulting firm found that the quality of the health services were not the same in all the countries above. A poor quality of a surgery may have significant repercussions in future, resulting in more cost in correcting mistakes. The cost of poor quality of surgery is given in the table below.
âââââââ
Approximately, what difference in amount in Bahts will it make to a Thai citizen if she were to get a hysterectomy done in India instead of in her native country, taking into account the cost of poor quality? It costs 7500 Bahts for one-way travel between Thailand and India.
Answer the following question based on the information given below.
The table below shows the comparative costs, in US Dollars, of major surgeries in USA and a select few Asian countries.
âââââââ
The equivalent of one US Dollar in the local currencies is given below.
âââââââ
A consulting firm found that the quality of the health services were not the same in all the countries above. A poor quality of a surgery may have significant repercussions in future, resulting in more cost in correcting mistakes. The cost of poor quality of surgery is given in the table below.
âââââââ
A US citizen is hurt in an accident and requires an angioplasty, hip replacement and a knee replacement. Cost of foreign travel and stay is not a consideration since the government will take care of it. Which country will result in the cheapest package, taking cost of poor quality into account?
Answer the following question based on the information given below.
The table below shows the comparative costs, in US Dollars, of major surgeries in USA and a select few Asian countries.
âââââââ
The equivalent of one US Dollar in the local currencies is given below.
âââââââ
A consulting firm found that the quality of the health services were not the same in all the countries above. A poor quality of a surgery may have significant repercussions in future, resulting in more cost in correcting mistakes. The cost of poor quality of surgery is given in the table below.
âââââââ
Taking the cost of poor quality into account, which country/countries will be the most expensive for knee replacement?
Answer the following question based on the information given below.
A health-drink company’s R&D department is trying to make various diet formulations, which can be used for certain specific purposes. It is considering a choice of 5 alternative ingredients (O, P, Q, R, and S), which can be used in different proportions in the formulations. The table below gives the composition of these ingredients. The cost per unit of each of these ingredients is O: 150, P: 50, Q: 200, R: 500, S: 100.
 âââââââ
The company is planning to launch a balanced diet required for growth needs of adolescent children. This diet must contain at least 30% each of carbohydrate and protein, no more than 25% fat and at least 5% minerals. Which one of the following combinations of equally mixed ingredients is feasible?
Answer the following question based on the information given below.
A health-drink company’s R&D department is trying to make various diet formulations, which can be used for certain specific purposes. It is considering a choice of 5 alternative ingredients (O, P, Q, R, and S), which can be used in different proportions in the formulations. The table below gives the composition of these ingredients. The cost per unit of each of these ingredients is O: 150, P: 50, Q: 200, R: 500, S: 100.
âââââââ
For a recuperating patient, the doctor recommended a diet containing 10% minerals and at least 30% protein. In how many different ways can we prepare this diet by mixing at least two ingredients?
Answer the following question based on the information given below.
A health-drink company’s R&D department is trying to make various diet formulations, which can be used for certain specific purposes. It is considering a choice of 5 alternative ingredients (O, P, Q, R, and S), which can be used in different proportions in the formulations. The table below gives the composition of these ingredients. The cost per unit of each of these ingredients is O: 150, P: 50, Q: 200, R: 500, S: 100.
âââââââ
Which among the following is the formulation having the lowest cost per unit for a diet having 10% fat and at least 30% protein? The diet has to be formed by mixing two ingredients.
Answer the following question based on the information given below.
A health-drink company’s R&D department is trying to make various diet formulations, which can be used for certain specific purposes. It is considering a choice of 5 alternative ingredients (O, P, Q, R, and S), which can be used in different proportions in the formulations. The table below gives the composition of these ingredients. The cost per unit of each of these ingredients is O: 150, P: 50, Q: 200, R: 500, S: 100.
âââââââ
In what proportion should P, Q and S be mixed to make a diet having at least 60% carbohydrate at the lowest per unit cost?
Answer the following question based on the information given below.
In a Class X Board examination, ten papers are distributed over five Groups – PCB, Mathematics, Social Science, Vernacular and English. Each of the ten papers is evaluated out of 100. The final score of a student is calculated in the following manner. First, the Group Scores are obtained by averaging marks in the papers within the Group. The final score is the simple average of the Group Scores. The data for the top ten students are presented below. (Dipan’s score in English Paper II has been intentionally removed in the table).
Note: B or G against the name of a student respectively indicates whether the student is a boy or a girl.
 âââââââ
How much did Dipan get in English Paper II?
Answer the following question based on the information given below.
In a Class X Board examination, ten papers are distributed over five Groups – PCB, Mathematics, Social Science, Vernacular and English. Each of the ten papers is evaluated out of 100. The final score of a student is calculated in the following manner. First, the Group Scores are obtained by averaging marks in the papers within the Group. The final score is the simple average of the Group Scores. The data for the top ten students are presented below. (Dipan’s score in English Paper II has been intentionally removed in the table).
Note: B or G against the name of a student respectively indicates whether the student is a boy or a girl.
âââââââ
Students who obtained Group Scores of at least 95 in every group are eligible to apply for a prize. Among those who are eligible, the student obtaining the highest Group Score in Social Science Group is awarded this prize. The prize was awarded to:
Answer the following question based on the information given below.
In a Class X Board examination, ten papers are distributed over five Groups – PCB, Mathematics, Social Science, Vernacular and English. Each of the ten papers is evaluated out of 100. The final score of a student is calculated in the following manner. First, the Group Scores are obtained by averaging marks in the papers within the Group. The final score is the simple average of the Group Scores. The data for the top ten students are presented below. (Dipan’s score in English Paper II has been intentionally removed in the table).
Note: B or G against the name of a student respectively indicates whether the student is a boy or a girl.
âââââââ
Among the top ten students, how many boys scored at least 95 in at least one paper from each of the groups?
Answer the following question based on the information given below.
In a Class X Board examination, ten papers are distributed over five Groups – PCB, Mathematics, Social Science, Vernacular and English. Each of the ten papers is evaluated out of 100. The final score of a student is calculated in the following manner. First, the Group Scores are obtained by averaging marks in the papers within the Group. The final score is the simple average of the Group Scores. The data for the top ten students are presented below. (Dipan’s score in English Paper II has been intentionally removed in the table).
Note: B or G against the name of a student respectively indicates whether the student is a boy or a girl.
âââââââ
Each of the ten students was allowed to improve his/her score in exactly one paper of choice with the objective of maximizing his/her final score. Everyone scored 100 in the paper in which he or she chose to improve. After that, the topper among the ten students was:
Answer the following question based on the information given below.
In a Class X Board examination, ten papers are distributed over five Groups – PCB, Mathematics, Social Science, Vernacular and English. Each of the ten papers is evaluated out of 100. The final score of a student is calculated in the following manner. First, the Group Scores are obtained by averaging marks in the papers within the Group. The final score is the simple average of the Group Scores. The data for the top ten students are presented below. (Dipan’s score in English Paper II has been intentionally removed in the table).
Note: B or G against the name of a student respectively indicates whether the student is a boy or a girl.
âââââââ
Had Joseph, Agni, Pritam and Tirna each obtained Group Score of 100 in the Social Science Group, then their standing in decreasing order of final score would be:
Answer the following question based on the information given below.
A management institute was established on January 1, 2000 with 3, 4, 5, and 6 faculty members in the Marketing, Organisational Behaviour (OB), Finance, and Operations Management (OM) areas respectively, to start with. No faculty member retired or joined the institute in the first three months of the year 2000. In the next four years, the institute recruited one faculty member in each of the four areas. All these new faculty members, who joined the institute subsequently over the years, were 25 years old at the time of their joining the institute. All of them joined the institute on April 1. During these four years, one of the faculty members retired at the age of 60. The following diagram gives the area-wise average age (in terms of number of completed years) of faculty members as on April 1 of 2000, 2001, 2002, and 2003.

From which area did the faculty member retire?
Answer the following question based on the information given below.
A management institute was established on January 1, 2000 with 3, 4, 5, and 6 faculty members in the Marketing, Organisational Behaviour (OB), Finance, and Operations Management (OM) areas respectively, to start with. No faculty member retired or joined the institute in the first three months of the year 2000. In the next four years, the institute recruited one faculty member in each of the four areas. All these new faculty members, who joined the institute subsequently over the years, were 25 years old at the time of their joining the institute. All of them joined the institute on April 1. During these four years, one of the faculty members retired at the age of 60. The following diagram gives the area-wise average age (in terms of number of completed years) of faculty members as on April 1 of 2000, 2001, 2002, and 2003.
Professors Naresh and Devesh, two faculty members in the Marketing area, who have been with the Institute since its inception, share a birthday, which falls on 20th November. One was born in 1947 and the other one in 1950. On April 1 2005, what was the age of the third faculty member who has been in the same area since inception?
Answer the following question based on the information given below.
A management institute was established on January 1, 2000 with 3, 4, 5, and 6 faculty members in the Marketing, Organisational Behaviour (OB), Finance, and Operations Management (OM) areas respectively, to start with. No faculty member retired or joined the institute in the first three months of the year 2000. In the next four years, the institute recruited one faculty member in each of the four areas. All these new faculty members, who joined the institute subsequently over the years, were 25 years old at the time of their joining the institute. All of them joined the institute on April 1. During these four years, one of the faculty members retired at the age of 60. The following diagram gives the area-wise average age (in terms of number of completed years) of faculty members as on April 1 of 2000, 2001, 2002, and 2003.
In which year did the new faculty member join the Finance area?
Answer the following question based on the information given below.
The table below reports annual statistics related to rice production in select states of India for a particular year.
 âââââââ
Which two states account for the highest productivity of rice (tons produced per hectare of rice cultivation)?
Answer the following question based on the information given below.
The table below reports annual statistics related to rice production in select states of India for a particular year.
âââââââ
How many states have a per capita production of rice (defined as total rice production divided by its population) greater than Gujarat?
Answer the following question based on the information given below.
The table below reports annual statistics related to rice production in select states of India for a particular year.
âââââââ
An intensive rice producing state is defined as one whose annual rice production per million of population is at least 400,000 tons. How many states are intensive rice producing states?
Answer the following question based on the information given below.
The table below presents the revenue (in million rupees) of four firms in three states. These firms, Honest Ltd., Aggressive Ltd., Truthful Ltd. and Profitable Ltd. are disguised in the table as A, B, C and D, in no particular order.
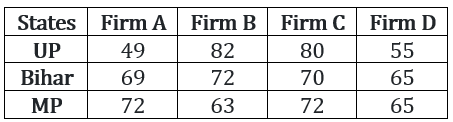 âââââââ
Further, it is known that:
- In the state of MP, Truthful Ltd. has the highest market share.
- Aggressive Ltd.’s aggregate revenue differs from Honest Ltd.’s by Rs. 5 million.
What can be said regarding the following two statements?
Statement 1: Profitable Ltd. has the lowest share in MP market.
Statement 2: Honest Ltd.’s total revenue is more than Profitable Ltd.
Answer the following question based on the information given below.
The table below presents the revenue (in million rupees) of four firms in three states. These firms, Honest Ltd., Aggressive Ltd., Truthful Ltd. and Profitable Ltd. are disguised in the table as A, B, C and D, in no particular order.
âââââââ
Further, it is known that:
- In the state of MP, Truthful Ltd. has the highest market share.
- Aggressive Ltd.’s aggregate revenue differs from Honest Ltd.’s by Rs. 5 million.
What can be said regarding the following two statements?
Statement 1: Aggressive Ltd.’s lowest revenues are from MP.
Statement 2: Honest Ltd.’s lowest revenues are from Bihar.
Answer the following question based on the information given below.
The table below presents the revenue (in million rupees) of four firms in three states. These firms, Honest Ltd., Aggressive Ltd., Truthful Ltd. and Profitable Ltd. are disguised in the table as A, B, C and D, in no particular order.
âââââââ
Further, it is known that:
- In the state of MP, Truthful Ltd. has the highest market share.
- Aggressive Ltd.’s aggregate revenue differs from Honest Ltd.’s by Rs. 5 million.
What can be said regarding the following two statements?
Statement 1: Honest Ltd. has the highest share in the UP market.
Statement 2: Aggressive Ltd. has the highest share in the Bihar market.
Answer the following question based on the information given below.
The table below presents the revenue (in million rupees) of four firms in three states. These firms, Honest Ltd., Aggressive Ltd., Truthful Ltd. and Profitable Ltd. are disguised in the table as A, B, C and D, in no particular order.
âââââââ
Further, it is known that:
- In the state of MP, Truthful Ltd. has the highest market share.
- Aggressive Ltd.’s aggregate revenue differs from Honest Ltd.’s by Rs. 5 million.
If Profitable Ltd.’s lowest revenue is from UP, then which of the following is true?
Answer the following question based on the information given below.
Prof. Singh has been tracking the number of visitors to his homepage. His service provider has provided him with the following data on the country of origin of the visitors and the university they belong to:
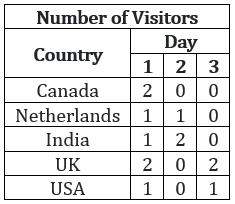 âââââââ
 âââââââ
University 1 can belong to ______.
Answer the following question based on the information given below.
Prof. Singh has been tracking the number of visitors to his homepage. His service provider has provided him with the following data on the country of origin of the visitors and the university they belong to:
âââââââ
âââââââ
To which country does University 5 belong?
Answer the following question based on the information given below.
Prof. Singh has been tracking the number of visitors to his homepage. His service provider has provided him with the following data on the country of origin of the visitors and the university they belong to:
âââââââ
âââââââ
Visitors from how many universities from UK visited Prof. Singh’s homepage in the three days?
Answer the following question based on the information given below.
Prof. Singh has been tracking the number of visitors to his homepage. His service provider has provided him with the following data on the country of origin of the visitors and the university they belong to:
âââââââ
âââââââ
Which among the listed countries can possibly host three of the eight listed universities?
Answer the following question based on the information given below.
The data points in the figure below represent monthly income and expenditure data of individual members of the Ahuja family , the Bose family , the Coomar family , and the Dubey family . For these questions, savings is defined as
Savings = Income − Expenditure

Which family has the highest average expenditure?
Answer the following question based on the information given below.
The data points in the figure below represent monthly income and expenditure data of individual members of the Ahuja family , the Bose family , the Coomar family , and the Dubey family . For these questions, savings is defined as
Savings = Income − Expenditure
Which family has the lowest average income?
Answer the following question based on the information given below.
The data points in the figure below represent monthly income and expenditure data of individual members of the Ahuja family , the Bose family , the Coomar family , and the Dubey family . For these questions, savings is defined as
Savings = Income − Expenditure
The highest amount of savings accrues to a member of which family?
Answer the following question based on the information given below.
The data points in the figure below represent monthly income and expenditure data of individual members of the Ahuja family , the Bose family , the Coomar family , and the Dubey family . For these questions, savings is defined as
Savings = Income − Expenditure
Which family has the lowest average savings?
Answer the following question based on the information given below.
The Dean’s office recently scanned student results into the central computer system. When their character reading software cannot read something, it leaves the space blank. The scanner output reads as follows:
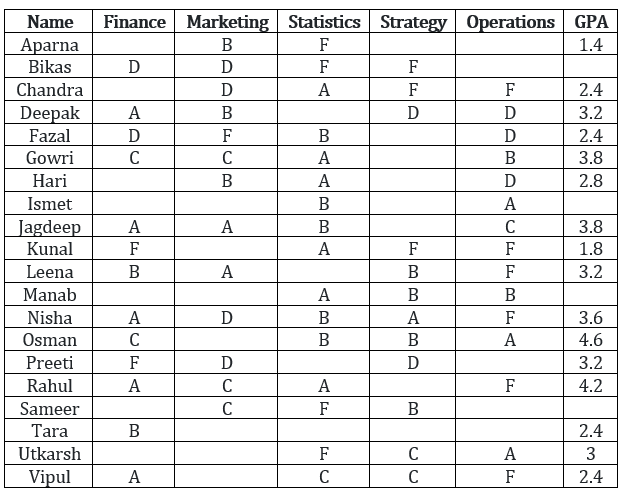 âââââââ
In the grading system, A, B, C, D, and F grades fetch 6, 4, 3, 2, and 0 grade points respectively. The Grade Point Average (GPA) is the arithmetic mean of the grade points obtained in the five subjects.
For example Nisha's GPA is 3.6
Some additional facts are also known about the students’ grades. These are:
a. Vipul obtained the same grade in Marketing as Aparna obtained in Finance and Strategy.
b. Fazal obtained the same grade in Strategy as Utkarsh did in Marketing.
c. Tara received the same grade in exactly three courses.
In Operations, Tara could have received the same grade as ____________.
Answer the following question based on the information given below.
The Dean’s office recently scanned student results into the central computer system. When their character reading software cannot read something, it leaves the space blank. The scanner output reads as follows:
âââââââ
In the grading system, A, B, C, D, and F grades fetch 6, 4, 3, 2, and 0 grade points respectively. The Grade Point Average (GPA) is the arithmetic mean of the grade points obtained in the five subjects.
For example Nisha's GPA is 3.6
Some additional facts are also known about the students’ grades. These are:
a. Vipul obtained the same grade in Marketing as Aparna obtained in Finance and Strategy.
b. Fazal obtained the same grade in Strategy as Utkarsh did in Marketing.
c. Tara received the same grade in exactly three courses.
What grade did Preeti obtain in Statistics?
Answer the following question based on the information given below.
The Dean’s office recently scanned student results into the central computer system. When their character reading software cannot read something, it leaves the space blank. The scanner output reads as follows:
âââââââ
In the grading system, A, B, C, D, and F grades fetch 6, 4, 3, 2, and 0 grade points respectively. The Grade Point Average (GPA) is the arithmetic mean of the grade points obtained in the five subjects.
For example Nisha's GPA is 3.6
Some additional facts are also known about the students’ grades. These are:
a. Vipul obtained the same grade in Marketing as Aparna obtained in Finance and Strategy.
b. Fazal obtained the same grade in Strategy as Utkarsh did in Marketing.
c. Tara received the same grade in exactly three courses.
What grade did Utkarsh obtain in Finance?
Answer the following question based on the information given below.
The Dean’s office recently scanned student results into the central computer system. When their character reading software cannot read something, it leaves the space blank. The scanner output reads as follows:
âââââââ
In the grading system, A, B, C, D, and F grades fetch 6, 4, 3, 2, and 0 grade points respectively. The Grade Point Average (GPA) is the arithmetic mean of the grade points obtained in the five subjects.
For example Nisha's GPA is 3.6
Some additional facts are also known about the students’ grades. These are:
a. Vipul obtained the same grade in Marketing as Aparna obtained in Finance and Strategy.
b. Fazal obtained the same grade in Strategy as Utkarsh did in Marketing.
c. Tara received the same grade in exactly three courses.
In Strategy, Gowri’s grade point was higher than that obtained by _________.
Answer the following question based on the information given below.
Purana and Naya are two brands of kitchen mixer-grinders available in the local market. Purana is an old brand that was introduced in 1990, while Naya was introduced in 1997. For both these brands, 20% of the mixer-grinders bought in a particular year are disposed off as junk exactly two years later. It is known that 10 Purana mixer-grinders were disposed off in 1997. The following figures show the number of Purana and Naya mixer-grinders in operation from 1995 to 2000, as at the end of the year.

How many Naya mixer-grinders were disposed of by the end of 2000?
Answer the following question based on the information given below.
Purana and Naya are two brands of kitchen mixer-grinders available in the local market. Purana is an old brand that was introduced in 1990, while Naya was introduced in 1997. For both these brands, 20% of the mixer-grinders bought in a particular year are disposed off as junk exactly two years later. It is known that 10 Purana mixer-grinders were disposed off in 1997. The following figures show the number of Purana and Naya mixer-grinders in operation from 1995 to 2000, as at the end of the year.
How many Naya mixer-grinders were purchased in 1999?
Answer the following question based on the information given below.
Purana and Naya are two brands of kitchen mixer-grinders available in the local market. Purana is an old brand that was introduced in 1990, while Naya was introduced in 1997. For both these brands, 20% of the mixer-grinders bought in a particular year are disposed off as junk exactly two years later. It is known that 10 Purana mixer-grinders were disposed off in 1997. The following figures show the number of Purana and Naya mixer-grinders in operation from 1995 to 2000, as at the end of the year.
How many Purana mixer-grinders were purchased in 1999?
Answer the following question based on the information given below.
Purana and Naya are two brands of kitchen mixer-grinders available in the local market. Purana is an old brand that was introduced in 1990, while Naya was introduced in 1997. For both these brands, 20% of the mixer-grinders bought in a particular year are disposed off as junk exactly two years later. It is known that 10 Purana mixer-grinders were disposed off in 1997. The following figures show the number of Purana and Naya mixer-grinders in operation from 1995 to 2000, as at the end of the year.
How many Purana mixer-grinders were disposed of in 2000?
Answer the following question based on the information given below.
Twenty one participants from four continents (Africa, Americas, Australasia, and Europe) attended a United Nations conference. Each participant was an expert in one of four fields, labour, health, population studies, and refugee relocation. The following five facts about the participants are given.
a. The number of labour experts in the camp was exactly half the number of experts in each of the three other categories.
b. Africa did not send any labour expert. Otherwise, every continent, including Africa, sent at least one expert for each category.
c. None of the continents sent more than three experts in any category.
d. If there had been one less Australasian expert, then the Americas would have had twice as many experts as each of the other continents.
e. Mike and Alfanso are leading experts of population studies who attended the conference. They are from Australasia.
Which of the following numbers cannot be determined from the information given?
Answer the following question based on the information given below.
Twenty one participants from four continents (Africa, Americas, Australasia, and Europe) attended a United Nations conference. Each participant was an expert in one of four fields, labour, health, population studies, and refugee relocation. The following five facts about the participants are given.
a. The number of labour experts in the camp was exactly half the number of experts in each of the three other categories.
b. Africa did not send any labour expert. Otherwise, every continent, including Africa, sent at least one expert for each category.
c. None of the continents sent more than three experts in any category.
d. If there had been one less Australasian expert, then the Americas would have had twice as many experts as each of the other continents.
e. Mike and Alfanso are leading experts of population studies who attended the conference. They are from Australasia.
Which of the following combinations is NOT possible?
Answer the following question based on the information given below.
Twenty one participants from four continents (Africa, Americas, Australasia, and Europe) attended a United Nations conference. Each participant was an expert in one of four fields, labour, health, population studies, and refugee relocation. The following five facts about the participants are given.
a. The number of labour experts in the camp was exactly half the number of experts in each of the three other categories.
b. Africa did not send any labour expert. Otherwise, every continent, including Africa, sent at least one expert for each category.
c. None of the continents sent more than three experts in any category.
d. If there had been one less Australasian expert, then the Americas would have had twice as many experts as each of the other continents.
e. Mike and Alfanso are leading experts of population studies who attended the conference. They are from Australasia.
If Ramos is the lone American expert in population studies, which of the following is NOT true about the numbers of experts in the conference from the four continents?
Answer the following question based on the information given below.
Twenty one participants from four continents (Africa, Americas, Australasia, and Europe) attended a United Nations conference. Each participant was an expert in one of four fields, labour, health, population studies, and refugee relocation. The following five facts about the participants are given.
a. The number of labour experts in the camp was exactly half the number of experts in each of the three other categories.
b. Africa did not send any labour expert. Otherwise, every continent, including Africa, sent at least one expert for each category.
c. None of the continents sent more than three experts in any category.
d. If there had been one less Australasian expert, then the Americas would have had twice as many experts as each of the other continents.
e. Mike and Alfanso are leading experts of population studies who attended the conference. They are from Australasia.
Alex, an American expert in refugee relocation, was the first keynote speaker in the conference. What can be inferred about the number of American experts in refugee relocation in the conference, excluding Alex?
i. At least one
ii. At most two
Answer the following question based on the information given below.
The length of an infant is one of the measures of his/her development in the early stages of his/her life. The figure below shows the growth chart of four infants in the first five months of life.
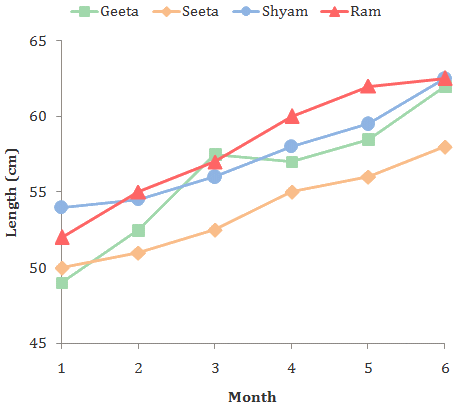
After which month did Seeta's rate of growth start to decline?
Answer the following question based on the information given below.
The length of an infant is one of the measures of his/her development in the early stages of his/her life. The figure below shows the growth chart of four infants in the first five months of life.
Who grew at the fastest rate in the first two months of life?
Answer the following question based on the information given below.
The length of an infant is one of the measures of his/her development in the early stages of his/her life. The figure below shows the growth chart of four infants in the first five months of life.
The rate of growth during the third month was the lowest for ___.
Answer the following question based on the information given below.
The length of an infant is one of the measures of his/her development in the early stages of his/her life. The figure below shows the growth chart of four infants in the first five months of life.
Among the four infants, who grew the least in the first five months of life?
âââââââAnswer the following question based on the information given below.
A research agency collected the following data regarding the admission process of a reputed management school in India.
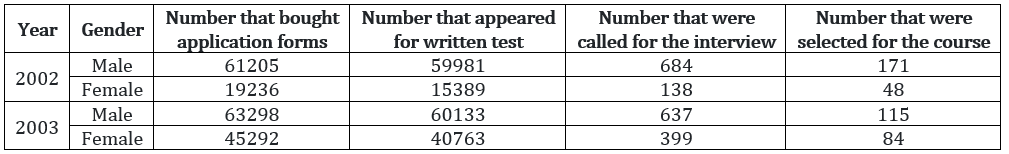 âââââââ
âââââââChoose 1 if only A is true
Choose 2 if only B is true
Choose 3 if both A and B are true
Choose 4 if neither A nor B is true
Statement A: The success rate of moving from written test to interview stage for males was worse than for females in 2003.
Statement B: The success rate of moving from written test to interview stage for females was better in 2002 than in 2003.
âââââââAnswer the following question based on the information given below.
A research agency collected the following data regarding the admission process of a reputed management school in India.
âââââââ
âââââââChoose 1 if only A is true
Choose 2 if only B is true
Choose 3 if both A and B are true
Choose 4 if neither A nor B is true
Statement A: In 2002, the number of females selected for the course as a proportion of the number of females who bought application forms, was higher than the corresponding proportion for males.
Statement B: In 2002, among those called for interview, males had a greater success rate than females.
âââââââAnswer the following question based on the information given below.
A research agency collected the following data regarding the admission process of a reputed management school in India.
âââââââ
âââââââChoose 1 if only A is true
Choose 2 if only B is true
Choose 3 if both A and B are true
Choose 4 if neither A nor B is true
Statement A: The percentage of absentees in the written test among females decreased from 2002 to 2003.
Statement B: The percentage of absentees in the written test among males was larger than among females in 2003.
Answer the following question based on the information given below.
The table below provides certain demographic details of 30 respondents who were part of a survey. The demographic characteristics are: gender, number of children and age of respondents. The first number in each cell is the number of respondents in that group. The minimum and maximum age of respondents in each group is given in brackets. For example, there are five female respondents with no children and among these five, the youngest is 34 years old, while the oldest is 49.
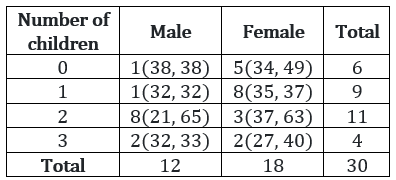 âââââââ
The percentage of respondents aged less than 40 years is at least ___.
Answer the following question based on the information given below.
The table below provides certain demographic details of 30 respondents who were part of a survey. The demographic characteristics are: gender, number of children and age of respondents. The first number in each cell is the number of respondents in that group. The minimum and maximum age of respondents in each group is given in brackets. For example, there are five female respondents with no children and among these five, the youngest is 34 years old, while the oldest is 49.
âââââââ
Given the information above, the percentage of respondents older than 35 can be at most ___.
Answer the following question based on the information given below.
The table below provides certain demographic details of 30 respondents who were part of a survey. The demographic characteristics are: gender, number of children and age of respondents. The first number in each cell is the number of respondents in that group. The minimum and maximum age of respondents in each group is given in brackets. For example, there are five female respondents with no children and among these five, the youngest is 34 years old, while the oldest is 49.
âââââââ
The percentage of respondents that fall into the 35 to 40 years age group (both inclusive) is at least ___.
Answer the following question based on the information given below.
Spam that enters our electronic mailboxes can be classified under several spam heads. The following table shows the distribution of such spam worldwide over time. The total number of spam emails received during December 2002 was larger than the number received in June 2003. The total number of spam emails received during September 2002 was larger than the number received in March 2003. The figures in the table represent the percentage of all spam emails received during that period, falling into those respective categories.
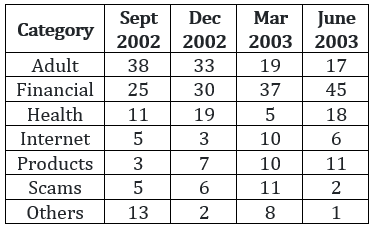 âââââââ
In which category was the percentage of spam emails increasing but at a decreasing rate?
Answer the following question based on the information given below.
Spam that enters our electronic mailboxes can be classified under several spam heads. The following table shows the distribution of such spam worldwide over time. The total number of spam emails received during December 2002 was larger than the number received in June 2003. The total number of spam emails received during September 2002 was larger than the number received in March 2003. The figures in the table represent the percentage of all spam emails received during that period, falling into those respective categories.
âââââââ
In the health category, the number of spam emails received in December 2002 as compared to June 2003
Answer the following question based on the information given below.
Spam that enters our electronic mailboxes can be classified under several spam heads. The following table shows the distribution of such spam worldwide over time. The total number of spam emails received during December 2002 was larger than the number received in June 2003. The total number of spam emails received during September 2002 was larger than the number received in March 2003. The figures in the table represent the percentage of all spam emails received during that period, falling into those respective categories.
âââââââ
In the financial category, the number of spam emails received in September 2002 as compared to March 2003
Answer the following question based on the information given below.
One of the functions of the Reserve Bank of India is to mobilize funds for the Government of India by issuing securities. The following table shows details of funds mobilized during the period July 2002-July 2003. Notice that on each date there were two rounds of issues, each with a different maturity.
 âââââââ
How many times was the issue of securities under-subscribed, i.e., how often did the total amount mobilized fall short of the amount notified?
Answer the following question based on the information given below.
One of the functions of the Reserve Bank of India is to mobilize funds for the Government of India by issuing securities. The following table shows details of funds mobilized during the period July 2002-July 2003. Notice that on each date there were two rounds of issues, each with a different maturity.
âââââââ
Which of the following is true?
Answer the following question based on the information given below.
One of the functions of the Reserve Bank of India is to mobilize funds for the Government of India by issuing securities. The following table shows details of funds mobilized during the period July 2002-July 2003. Notice that on each date there were two rounds of issues, each with a different maturity.
âââââââ
Which of the following statements is NOT true?
Answer the following question based on the information given below.
Each point in the graph below shows the profit and turnover data for a company. Each company belongs to one of the three industries: textile, cement and steel.
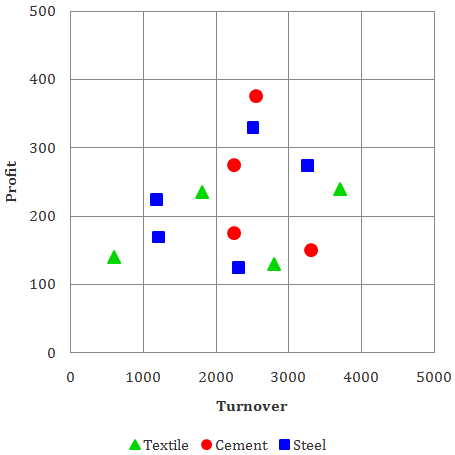
For how many companies does the profit exceed 10% of turnover?
Answer the following question based on the information given below.
Each point in the graph below shows the profit and turnover data for a company. Each company belongs to one of the three industries: textile, cement and steel.
For how many steel companies with a turnover of more than 2000 is the profit less than 300?
Answer the following question based on the information given below.
Each point in the graph below shows the profit and turnover data for a company. Each company belongs to one of the three industries: textile, cement and steel.
An investor wants to buy stock of only steel or cement companies with a turnover more than 1000 and profit exceeding 10% of turnover. How many choices are available to the investor?
Answer the following question based on the information given below.
Details of the top 20 MBA schools in the US as ranked by US News and World Report, 1997 are given below.
âââââââ
Madhu has received admission in all schools listed above. She wishes to select the highest overall ranked school whose
A. Annual tuition fee does not exceed $23,000 and
B. Median starting salary is at least $70,000Which school will she select?
Answer the following question based on the information given below.
Details of the top 20 MBA schools in the US as ranked by US News and World Report, 1997 are given below.
âââââââ
In terms of starting salary and tuition fee, how many schools are uniformly better (higher median starting salary AND lower tuition fee) than Dartmouth College?
Answer the following question based on the information given below.
Details of the top 20 MBA schools in the US as ranked by US News and World Report, 1997 are given below.
âââââââ
How many schools in the list above have single digit rankings on at least 3 of the 4 parameters (overall ranking, ranking by academics, ranking by recruiters and ranking by placement)?
Answer the following question based on the information given below.
Table A below provides data about ages of children in a school. For the age given in the first column, the second column gives the number of children not exceeding that age. For example, first entry indicates that there are 9 children aged 4 years or less. Tables B and C provide data on the heights and weights respectively of the same group of children in a similar format. Assuming that an older child is always taller and weighs more than a younger child, answer the following questions.
 âââââââ
What is the number of children of age 9 years or less whose height does not exceed 135 cm?
Answer the following question based on the information given below.
Table A below provides data about ages of children in a school. For the age given in the first column, the second column gives the number of children not exceeding that age. For example, first entry indicates that there are 9 children aged 4 years or less. Tables B and C provide data on the heights and weights respectively of the same group of children in a similar format. Assuming that an older child is always taller and weighs more than a younger child, answer the following questions.
âââââââ
How many children of age more than 10 years are taller than 150 cm and do not weigh more than 48 kg?
Answer the following question based on the information given below.
Table A below provides data about ages of children in a school. For the age given in the first column, the second column gives the number of children not exceeding that age. For example, first entry indicates that there are 9 children aged 4 years or less. Tables B and C provide data on the heights and weights respectively of the same group of children in a similar format. Assuming that an older child is always taller and weighs more than a younger child, answer the following questions.
âââââââ
Among the children older than 6 years but not exceeding 12 years, how many weigh more than 38 kg?
Answer the following question based on the information given below.
An industry comprises four firms (A, B, C, and D). Financial details of these firms and of the industry as a whole for a particular year are given below. Profitability of a firm is defined as profit as a percentage of sales.
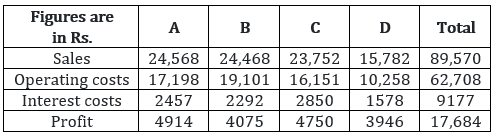 âââââââ
Which firm has the highest profitability?
Answer the following question based on the information given below.
An industry comprises four firms (A, B, C, and D). Financial details of these firms and of the industry as a whole for a particular year are given below. Profitability of a firm is defined as profit as a percentage of sales.
âââââââ
If Firm A acquires Firm B, approximately what percentage of the total market (total sales) will they corner together?
Answer the following question based on the information given below.
Five women decided to go shopping to M.G. Road, Bangalore. They arrived at the designated meeting place in the following order: 1. Archana, 2. Chellamma, 3. Dhenuka, 4. Helen, and 5. Shahnaz. Each woman spent at least Rs. 1000. Below are some additional facts about how much they spent during their shopping spree.
i. The woman who spent Rs. 2234 arrived before the lady who spent Rs. 1193.
ii. One woman spent Rs. 1340 and she was not Dhenuka.
iii. One woman spent Rs. 1378 more than Chellamma.
iv. One woman spent Rs. 2517 and she was not Archana.
v. Helen spent more than Dhenuka.
vi. Shahnaz spent the largest amount and Chellamma the smallest.
What was the amount spent by Helen?
Answer the following question based on the information given below.
Five women decided to go shopping to M.G. Road, Bangalore. They arrived at the designated meeting place in the following order: 1. Archana, 2. Chellamma, 3. Dhenuka, 4. Helen, and 5. Shahnaz. Each woman spent at least Rs. 1000. Below are some additional facts about how much they spent during their shopping spree.
i. The woman who spent Rs. 2234 arrived before the lady who spent Rs. 1193.
ii. One woman spent Rs. 1340 and she was not Dhenuka.
iii. One woman spent Rs. 1378 more than Chellamma.
iv. One woman spent Rs. 2517 and she was not Archana.
v. Helen spent more than Dhenuka.
vi. Shahnaz spent the largest amount and Chellamma the smallest.
Which of the following amounts was spent by one of them?
Answer the following question based on the information given below.
Five women decided to go shopping to M.G. Road, Bangalore. They arrived at the designated meeting place in the following order: 1. Archana, 2. Chellamma, 3. Dhenuka, 4. Helen, and 5. Shahnaz. Each woman spent at least Rs. 1000. Below are some additional facts about how much they spent during their shopping spree.
i. The woman who spent Rs. 2234 arrived before the lady who spent Rs. 1193.
ii. One woman spent Rs. 1340 and she was not Dhenuka.
iii. One woman spent Rs. 1378 more than Chellamma.
iv. One woman spent Rs. 2517 and she was not Archana.
v. Helen spent more than Dhenuka.
vi. Shahnaz spent the largest amount and Chellamma the smallest.
The woman who spent Rs. 1193 is
âââââââAnswer the following question based on the information given below.
Below is a table that lists countries region-wise. Each region-wise list is sorted, first by birth rate and then alphabetically by the name of the country. We now wish to merge the region-wise list into one consolidated list and provide overall rankings to each country based first on birth rate and then on death rate. Thus, if some countries have the same birth rate, then the country with a lower death rate will be ranked higher. Further, countries having identical birth and death rates will get the same rank. For example, if two countries are tied for the third position, then both will be given rank 3, while the next country (in the ordered list) will be ranked 5.
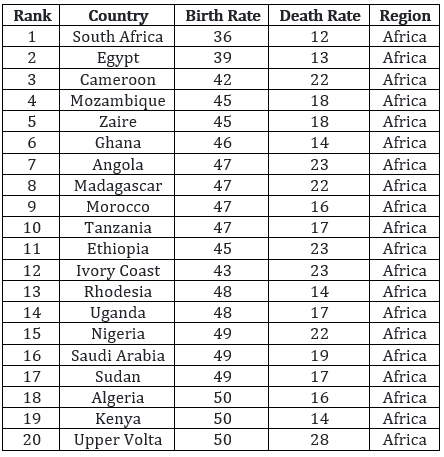 âââââââ
 âââââââ
 âââââââ
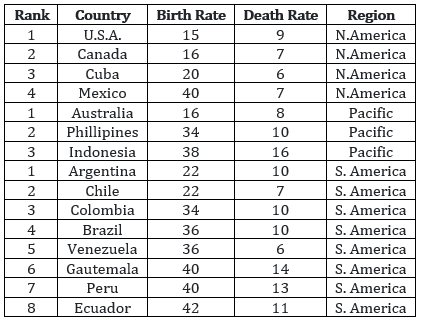 âââââââ
In the consolidated list, what would be the overall rank of the Philippines?
âââââââAnswer the following question based on the information given below.
Below is a table that lists countries region-wise. Each region-wise list is sorted, first by birth rate and then alphabetically by the name of the country. We now wish to merge the region-wise list into one consolidated list and provide overall rankings to each country based first on birth rate and then on death rate. Thus, if some countries have the same birth rate, then the country with a lower death rate will be ranked higher. Further, countries having identical birth and death rates will get the same rank. For example, if two countries are tied for the third position, then both will be given rank 3, while the next country (in the ordered list) will be ranked 5.
âââââââ
âââââââ
âââââââ
âââââââ
In the consolidated list, how many countries would rank below Spain and above Taiwan?
âââââââAnswer the following question based on the information given below.
Below is a table that lists countries region-wise. Each region-wise list is sorted, first by birth rate and then alphabetically by the name of the country. We now wish to merge the region-wise list into one consolidated list and provide overall rankings to each country based first on birth rate and then on death rate. Thus, if some countries have the same birth rate, then the country with a lower death rate will be ranked higher. Further, countries having identical birth and death rates will get the same rank. For example, if two countries are tied for the third position, then both will be given rank 3, while the next country (in the ordered list) will be ranked 5.
âââââââ
âââââââ
âââââââ
âââââââ
In the consolidated list, which country ranks 37th?
âââââââAnswer the following question based on the information given below.
Below is a table that lists countries region-wise. Each region-wise list is sorted, first by birth rate and then alphabetically by the name of the country. We now wish to merge the region-wise list into one consolidated list and provide overall rankings to each country based first on birth rate and then on death rate. Thus, if some countries have the same birth rate, then the country with a lower death rate will be ranked higher. Further, countries having identical birth and death rates will get the same rank. For example, if two countries are tied for the third position, then both will be given rank 3, while the next country (in the ordered list) will be ranked 5.
âââââââ
âââââââ
âââââââ
âââââââ
In the consolidated list, how many countries in Asia will rank lower than every country in South America, but higher than at least one country in Africa?
Answer the following question based on the information given below.
Answer the questions on the basis of the following charts.
(Note: Availability is defined as production less export.)
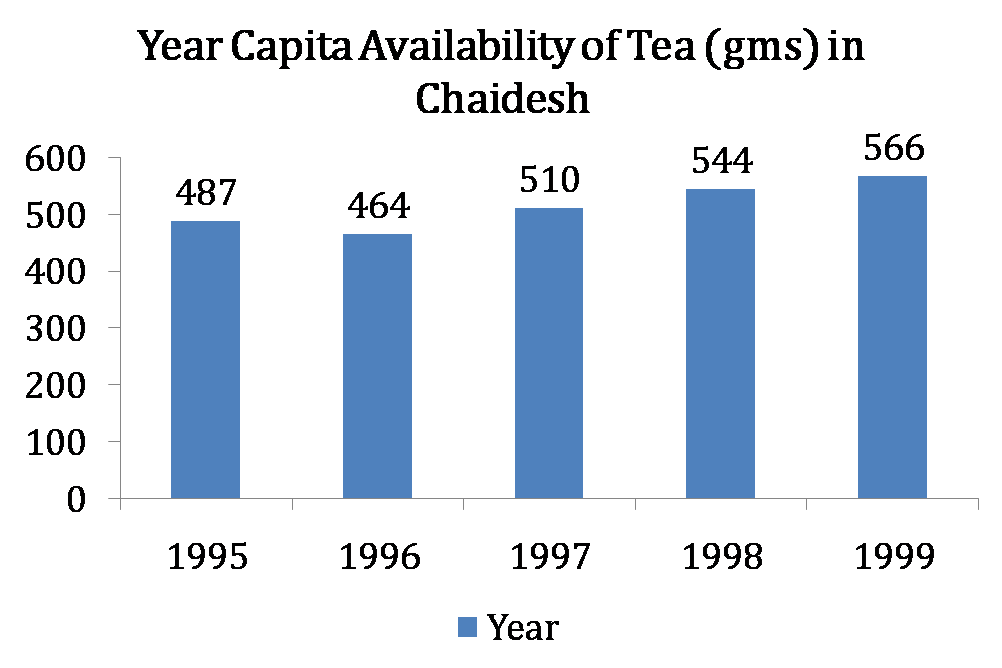

In which year during the period 1996-1999 was Chaidesh’s export of tea, as a proportion of tea produced, the highest?
Answer the following question based on the information given below.
Answer the questions on the basis of the following charts.
(Note: Availability is defined as production less export.)
In which of the following years was the population of Chaidesh the lowest?
Answer the following question based on the information given below.
Answer the questions on the basis of the following charts.
(Note: Availability is defined as production less export.)
The area under tea cultivation continuously decreased in all four years from 1996 to 1999, by 10%, 7%, 4% and 1% respectively. In which year was tea productivity (production per unit of area) the highest?
Answer the following question based on the information given below.
The profitability of a company is defined as the ratio of its operating profit to its operating income, typically expressed in percentage. The following two charts show the operating income as well as the profitability of six companies in the Financial Years (F.Y.s) 2001-02 and 2002-03.
The operating profits of four of these companies are plotted against their respective operating income figures for the F.Y. 2002-03, in the third chart given below.

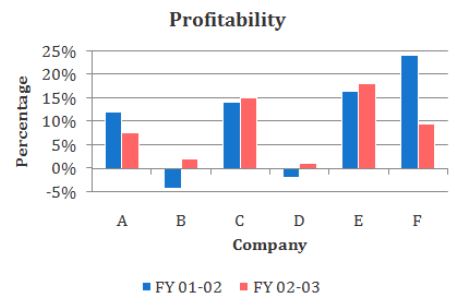
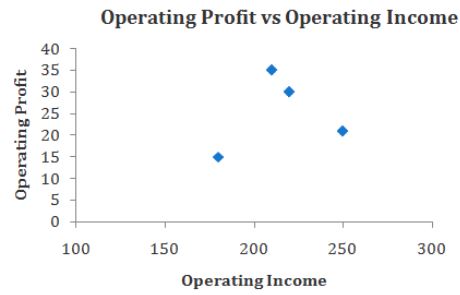
What is the approximate average operating profit, in F.Y. 2001-2002, of the two companies excluded from the third chart?
Answer the following question based on the information given below.
The profitability of a company is defined as the ratio of its operating profit to its operating income, typically expressed in percentage. The following two charts show the operating income as well as the profitability of six companies in the Financial Years (F.Y.s) 2001-02 and 2002-03.
The operating profits of four of these companies are plotted against their respective operating income figures for the F.Y. 2002-03, in the third chart given below.
Which company recorded the highest operating profit in F.Y. 2002-03?
Answer the following question based on the information given below.
The profitability of a company is defined as the ratio of its operating profit to its operating income, typically expressed in percentage. The following two charts show the operating income as well as the profitability of six companies in the Financial Years (F.Y.s) 2001-02 and 2002-03.
The operating profits of four of these companies are plotted against their respective operating income figures for the F.Y. 2002-03, in the third chart given below.
Which of the following statements is NOT true?
Answer the following question based on the information given below.
The profitability of a company is defined as the ratio of its operating profit to its operating income, typically expressed in percentage. The following two charts show the operating income as well as the profitability of six companies in the Financial Years (F.Y.s) 2001-02 and 2002-03.
The operating profits of four of these companies are plotted against their respective operating income figures for the F.Y. 2002-03, in the third chart given below.
The average operating profit in F.Y. 2002-03, of companies with profitability exceeding 10% in F.Y. 2002-03, is approximately
Answer the following question based on the information given below.
Answer the questions on the basis of the data presented in the figure below.
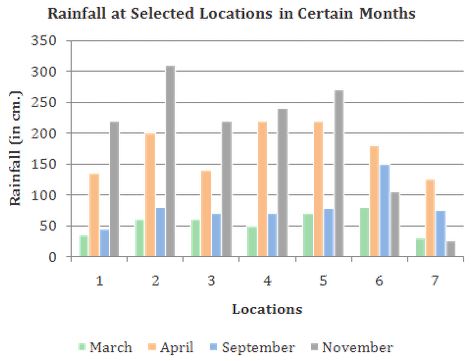
Which of the following statements is correct?
Answer the following question based on the information given below.
Answer the questions on the basis of the data presented in the figure below.
Locations 6 and 7 differ from all the rest because only in these two locations,
Answer the following question based on the information given below.
The following is the Wholesale Price Index (WPI) of a select list of items with the base year of 1993-94. In other words, all the item prices are made 100 in that year (1993-94). Price in all other years for an item are measured with respect to its price in the base year. For instance, the price of cement went up by 1% in 1994-95 as compared to 1993-94. Similarly, the price of power went up by 3% in 1996–97 as compared to 1993-94.
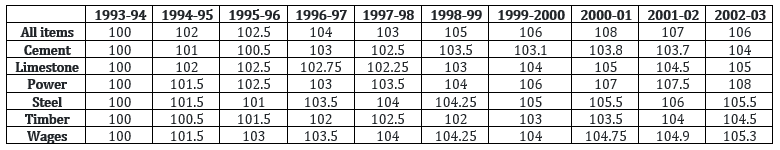 âââââââ
Let us suppose that one bag of cement (50 kgs) consumes 100 kgs of limestones and 10 units of power. The only other cost item in producing cement is in the form of wages. During 1993-94, limestone, power and wages contribute, respectively, 20%, 25%, and 15% to the cement price per bag. The average operating profit (% of price per cement bag) earned by a cement manufacturer during 2002-03 is closest to
Answer the following question based on the information given below.
The following is the Wholesale Price Index (WPI) of a select list of items with the base year of 1993-94. In other words, all the item prices are made 100 in that year (1993-94). Price in all other years for an item are measured with respect to its price in the base year. For instance, the price of cement went up by 1% in 1994-95 as compared to 1993-94. Similarly, the price of power went up by 3% in 1996–97 as compared to 1993-94.
âââââââ
Steel manufacturing requires the use of iron ore, power and manpower. The cost of iron ore has followed the All Item index. During 1993-94 power accounted for 30% of the selling price of steel, iron ore for 25%, and wages for 10% of the selling price of steel. Assuming the cost and price data for cement as given in the previous question, the operating profit (% of selling price) of an average steel manufacture in 2002-03
Answer the following question based on the information given below.
The following is the Wholesale Price Index (WPI) of a select list of items with the base year of 1993-94. In other words, all the item prices are made 100 in that year (1993-94). Price in all other years for an item are measured with respect to its price in the base year. For instance, the price of cement went up by 1% in 1994-95 as compared to 1993-94. Similarly, the price of power went up by 3% in 1996–97 as compared to 1993-94.
âââââââ
Which item experienced continuous price rise during the ten-year period?
Answer the following question based on the information given below.
The following is the Wholesale Price Index (WPI) of a select list of items with the base year of 1993-94. In other words, all the item prices are made 100 in that year (1993-94). Price in all other years for an item are measured with respect to its price in the base year. For instance, the price of cement went up by 1% in 1994-95 as compared to 1993-94. Similarly, the price of power went up by 3% in 1996–97 as compared to 1993-94.
âââââââ
Which item(s) experienced only one decline in price during the ten-year period?
Answer the following question based on the information given below.
Sex Ratio (Number of females per 1,000 males) of Selected States in India : 1901-2001
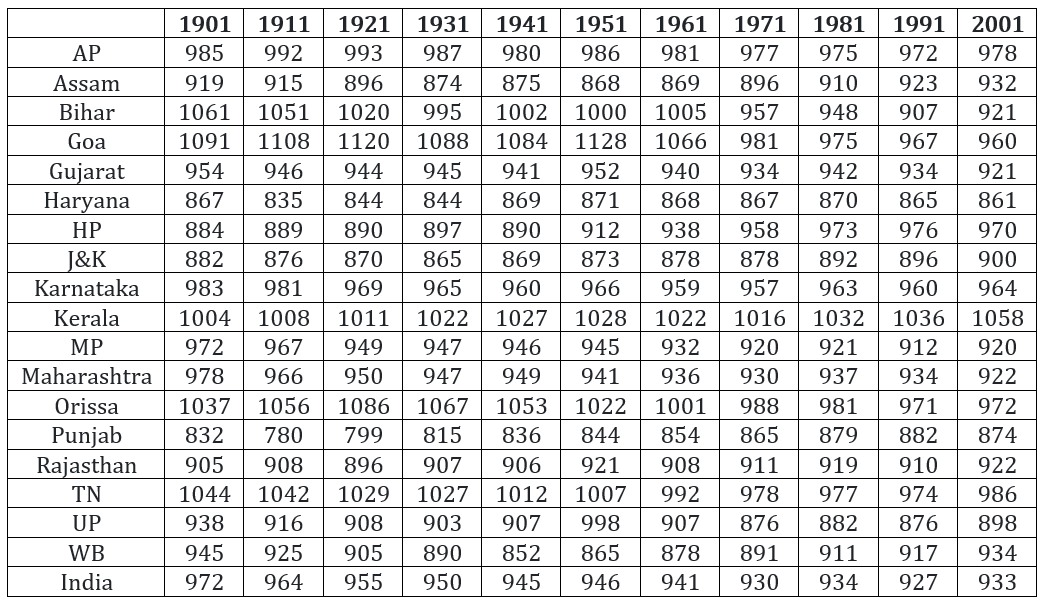 âââââââ
Each of the following statements pertains to the number of states with females outnumbering males in a given census year. Which of these statements is NOT correct?
Answer the following question based on the information given below.
Sex Ratio (Number of females per 1,000 males) of Selected States in India : 1901-2001
âââââââ
The two states which achieved the largest increases in sex ratio over the period 1901-2001 are
Answer the following question based on the information given below.
Sex Ratio (Number of females per 1,000 males) of Selected States in India : 1901-2001
âââââââ
Among the states which have a sex ratio exceeding 1000 in 1901, the sharpest decline over the period 1901-2001 was registered in the state of
Answer the following question based on the information given below.
Answer the questions on the basis of the data presented in the figure below.

During 1996-2002, the number of commodities that exhibited a net overall increase and a net overall decrease, respectively, were
Answer the following question based on the information given below.
Answer the questions on the basis of the data presented in the figure below.
The number of commodities that experienced a price decline for two or more consecutive years is
Answer the following question based on the information given below.
Answer the questions on the basis of the data presented in the figure below.
For which commodities did a price increase immediately follow a price decline only once in this period?
Answer the following question based on the information given below.
The chart given below indicates the annual sales tax revenue collections (in crores of rupees) of seven states from 1996 to 2001.
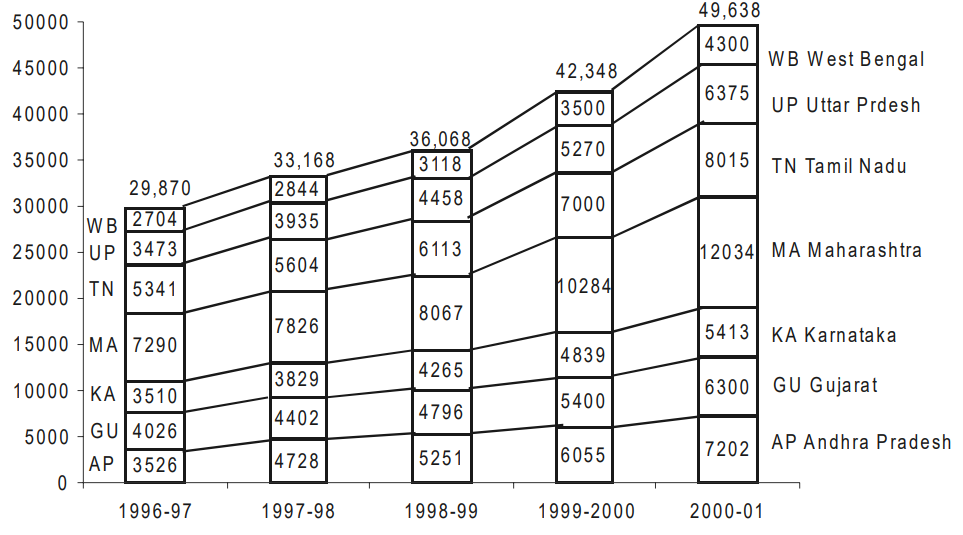
If for each year, the states are ranked in terms of descending order of sales tax collections, then how many states don't change their ranking more than once over the five years?
Answer the following question based on the information given below.
The chart given below indicates the annual sales tax revenue collections (in crores of rupees) of seven states from 1996 to 2001.
Which of the following states has changed its relative ranking most number of times when you rank the states in terms of the descending volume of sales tax collections each year?
Answer the following question based on the information given below.
The chart given below indicates the annual sales tax revenue collections (in crores of rupees) of seven states from 1996 to 2001.
The percentage share of sales tax revenue of which state has increased from 1997 to 2001?
Answer the following question based on the information given below.
The chart given below indicates the annual sales tax revenue collections (in crores of rupees) of seven states from 1996 to 2001.
Which pair of successive years shows the maximum growth rate of tax revenue in Maharashtra?
Answer the following question based on the information given below.
The chart given below indicates the annual sales tax revenue collections (in crores of rupees) of seven states from 1996 to 2001.
Identify the state whose tax revenue increased exactly by the same amount in two successive pair of years?
Answer the following question based on the information given below.
The chart given below indicates the annual sales tax revenue collections (in crores of rupees) of seven states from 1996 to 2001.
Which state below has been maintaining a constant rank over the years in terms of its contribution to the total tax collections?
Answer the following question based on the information given below.
Answer these questions based on the table given below.
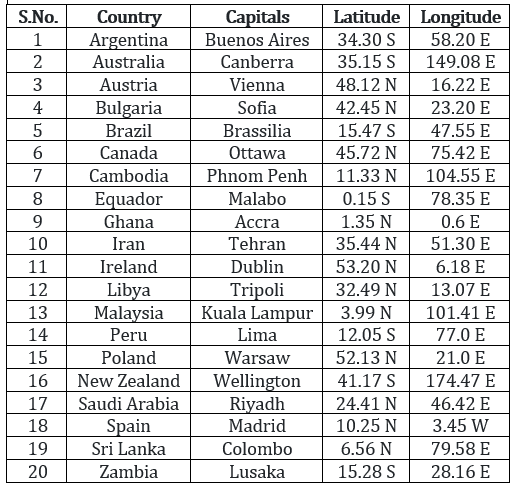 ââââââââââââââ
What percentage of cities located within 10° E and 40° E (10° east and 40° east) lie in the Southern Hemisphere?
Answer the following question based on the information given below.
Answer these questions based on the table given below.
ââââââââââââââ
The number of cities whose name begin with a consonant and are in the Northern Hemisphere in the table:
Answer the following question based on the information given below.
Answer these questions based on the table given below.
ââââââââââââââ
The ratio of the number of countries whose name starts with vowel and located in the Southern Hemisphere, to the number of countries, the name of whose capital cities starts with a vowel in the table above is:
Answer the following question based on the information given below.
The following table shows the earnings of employees in the month of June 2002. They generally worked 25 days in a month.
 ââââââââââââââ
The number of employees who have earned more than Rs. 50 per day in complex operation is:
Answer the following question based on the information given below.
The following table shows the earnings of employees in the month of June 2002. They generally worked 25 days in a month.
ââââââââââââââ
The number of employees who have earned more than Rs. 600 and having more than 80% attendance (there are 25 regular working days in June 2002; some might be coming on overtime too) is:
Answer the following question based on the information given below.
The following table shows the earnings of employees in the month of June 2002. They generally worked 25 days in a month.
ââââââââââââââ
The employee number of the person (among the following) who has earned the maximum earnings per day in medium operations is:
Answer the following question based on the information given below.
The following table shows the earnings of employees in the month of June 2002. They generally worked 25 days in a month.
ââââââââââââââ
Among the employees who were engaged in complex and medium operations, the number of employees whose average earnings per day in complex operations is more than their average earnings per day in medium operations is:
Answer the following question based on the information given below.
Following table shows the REPSOL YPF's Operations of oil and gas producing activities.
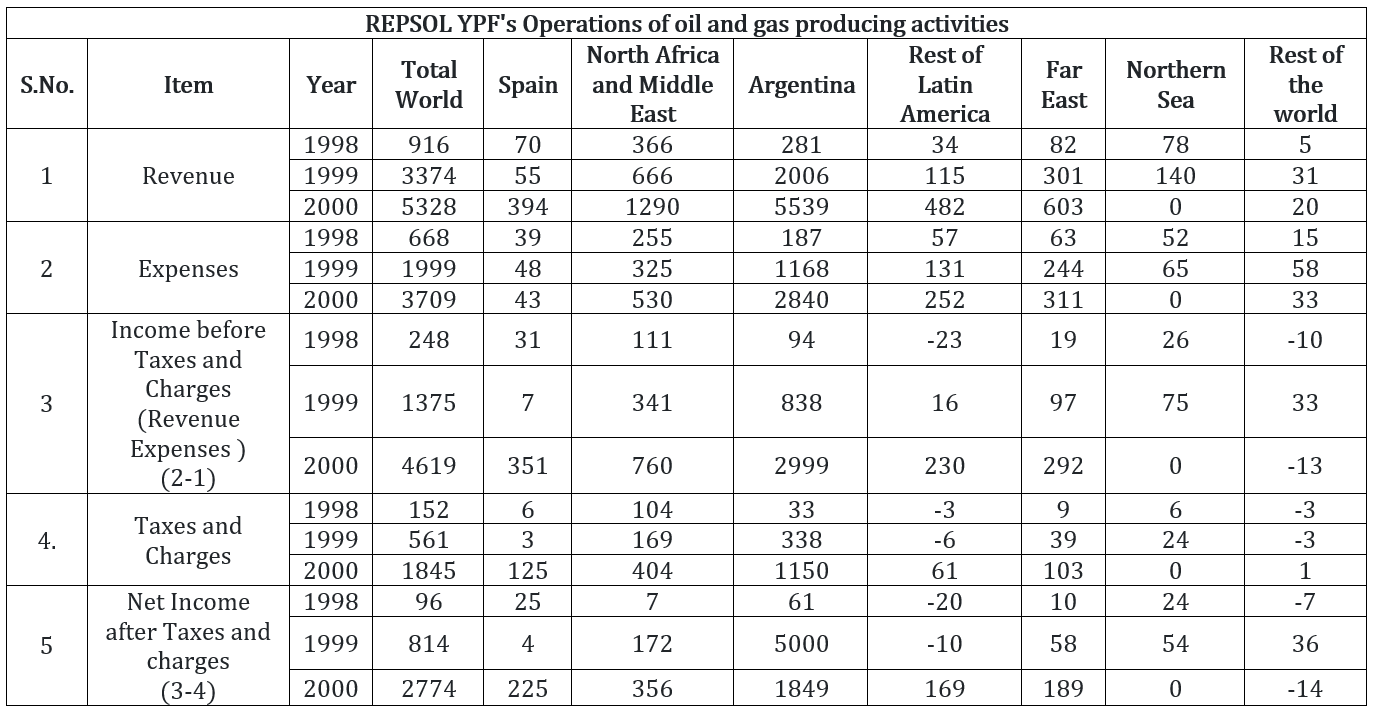 ââââââââââââââ
How many operations (Spain, North Africa and Middle East, …) of the company account for less than 5% of the total revenue earned in the year 1999?
Answer the following question based on the information given below.
Following table shows the REPSOL YPF's Operations of oil and gas producing activities.
ââââââââââââââ
How many operations (Spain, North Africa and Middle East, …) of the company account for less than 5% of the total revenue earned in the year 1999 to 2000?
Answer the following question based on the information given below.
Following table shows the REPSOL YPF's Operations of oil and gas producing activities.
ââââââââââââââ
How many operations registered a sustained yearly increase in income before taxes and charges from 1998 to 2000?
Answer the following question based on the information given below.
Following table shows the REPSOL YPF's Operations of oil and gas producing activities.
ââââââââââââââ
Ignoring the loss making operations of the company in 1998, for how many operations was the percentage increase in net income before taxes and charges higher than the average increase from 1998 to 1999?
Answer the following question based on the information given below.
Following table shows the REPSOL YPF's Operations of oil and gas producing activities.
ââââââââââââââ
If profitability is defined as the ratio of net income after taxes and charges to expenses, then which of the following statements is true?
Answer the following question based on the information given below.
Following table shows the REPSOL YPF's Operations of oil and gas producing activities.
ââââââââââââââ
In the year 2000, which among the following countries had the best profitability?
Answer the following question based on the information given below.
Following table shows the REPSOL YPF's Operations of oil and gas producing activities.
ââââââââââââââ
If efficiency is defined as the ratio of revenue to expenses, then which operation was the least efficient in the year 2000?
Answer the following question based on the information given below.
Following table shows the REPSOL YPF's Operations of oil and gas producing activities.
ââââââââââââââ
Of the following statements which is not true?
Answer the following question based on the information given below.
Chart A represents the distribution by value of top 6 suppliers of MFA Textiles in 1995. The total value of Chart A is 5760 million Euro.
Chart B represents the distribution by quantity of top 6 suppliers of MFA Textiles in 1995. The total value of Chart B is 1.05 million tons.


The country which has the highest average price is:
Answer the following question based on the information given below.
Chart A represents the distribution by value of top 6 suppliers of MFA Textiles in 1995. The total value of Chart A is 5760 million Euro.
Chart B represents the distribution by quantity of top 6 suppliers of MFA Textiles in 1995. The total value of Chart B is 1.05 million tons.
The average price (Euro per kg) in Turkey is roughly:
Answer the following question based on the information given below.
The following is a table describing garments manufactured based upon the colour and size each lay. There are four sizes: M-Medium, L-Large, XL-Extra Large and XXL-Extra Extra Large. There are three colours: Yellow, Red and White.
 âââââââ
How many lays are used to produce Yellow-coloured fabrics?
Answer the following question based on the information given below.
The following is a table describing garments manufactured based upon the colour and size each lay. There are four sizes: M-Medium, L-Large, XL-Extra Large and XXL-Extra Extra Large. There are three colours: Yellow, Red and White.
âââââââ
How many lays are used to produce Extra-Extra Large fabrics?
Answer the following question based on the information given below.
The following is a table describing garments manufactured based upon the colour and size each lay. There are four sizes: M-Medium, L-Large, XL-Extra Large and XXL-Extra Extra Large. There are three colours: Yellow, Red and White.
âââââââ
How many lays are used to produce Extra-Extra Large Yellow or Extra-Extra Large White fabrics?
Answer the following question based on the information given below.
The following is a table describing garments manufactured based upon the colour and size each lay. There are four sizes: M-Medium, L-Large, XL-Extra Large and XXL-Extra Extra Large. There are three colours: Yellow, Red and White.
âââââââ
How many varieties of fabrics, which exceed the order have been produced?
Answer the following question based on the information given below.
Answer these questions based on the table given below concerning the twenty busiest international airports in the world.
 âââââââ
How many international airports of type 'A' account for more than 40 million passengers?
Answer the following question based on the information given below.
Answer these questions based on the table given below concerning the twenty busiest international airports in the world.
âââââââ
What percentage of top ten busiest airports is in the United States of America?
Answer the following question based on the information given below.
Answer these questions based on the table given below concerning the twenty busiest international airports in the world.
âââââââ
Of the five busiest airports, roughly what percentage of passengers is handled by Heathrow airport?
Answer the following question based on the information given below.
Answer these questions based on the table given below concerning the twenty busiest international airports in the world.
âââââââ
How many international airports not located in the USA handle more than 30 million passengers?
Answer the following question based on the information given below.
Figure 1 shows the amount of work distribution, in man-hours, for a software between offshore and onsite activities. Figure 2 shows the estimated and actual work effort involved in the different offshore activities in the same company during the same period. [Note: Onsite refers to work performed at the customer's premise and offshore refers to work performed at the developer's premise.]

Which of the work requires as many man-hours as that spent in coding?
Answer the following question based on the information given below.
Figure 1 shows the amount of work distribution, in man-hours, for a software between offshore and onsite activities. Figure 2 shows the estimated and actual work effort involved in the different offshore activities in the same company during the same period. [Note: Onsite refers to work performed at the customer's premise and offshore refers to work performed at the developer's premise.]
Roughly what percentage of the total work is carried out onsite?
Answer the following question based on the information given below.
Figure 1 shows the amount of work distribution, in man-hours, for a software between offshore and onsite activities. Figure 2 shows the estimated and actual work effort involved in the different offshore activities in the same company during the same period. [Note: Onsite refers to work performed at the customer's premise and offshore refers to work performed at the developer's premise.]
The total effort in man-hours spent onsite is nearest to which of the following?
Answer the following question based on the information given below.
Figure 1 shows the amount of work distribution, in man-hours, for a software between offshore and onsite activities. Figure 2 shows the estimated and actual work effort involved in the different offshore activities in the same company during the same period. [Note: Onsite refers to work performed at the customer's premise and offshore refers to work performed at the developer's premise.]
If the total working hours were 100, which of the following tasks will account for approximately 50 hours?
Answer the following question based on the information given below.
Figure 1 shows the amount of work distribution, in man-hours, for a software between offshore and onsite activities. Figure 2 shows the estimated and actual work effort involved in the different offshore activities in the same company during the same period. [Note: Onsite refers to work performed at the customer's premise and offshore refers to work performed at the developer's premise.]
If 50 percent of the offshore work were to be carried out onsite, with the distribution of effort between the tasks remaining the same, the proportion of testing carried out offshore would be
Answer the following question based on the information given below.
Figure 1 shows the amount of work distribution, in man-hours, for a software between offshore and onsite activities. Figure 2 shows the estimated and actual work effort involved in the different offshore activities in the same company during the same period. [Note: Onsite refers to work performed at the customer's premise and offshore refers to work performed at the developer's premise.]
If 50 percent of the offshore work were to be carried out onsite, with the distribution of effort between the tasks remaining the same, which of the following is true of all work carried out onsite?
Answer the following question based on the information given below.
There are six companies, 1 through 6. All of these companies use six operations, A through F. The following graph shows the distribution of efforts put in by each company in these six operations.

Suppose effort allocation is interchanged between operation B and C, then C and D, and then D and E. If companies are then ranked in ascending order of effort in E, what will be the rank of company 3?
Answer the following question based on the information given below.
There are six companies, 1 through 6. All of these companies use six operations, A through F. The following graph shows the distribution of efforts put in by each company in these six operations.
A new technology is introduced in company 4 such that the total efforts for operations B through F get evenly distributed among these. What is the change in the percentage of effort in operation E?
Answer the following question based on the information given below.
There are six companies, 1 through 6. All of these companies use six operations, A through F. The following graph shows the distribution of efforts put in by each company in these six operations.
Suppose the companies find that they can remove operations B, C and D and redistribute the effort released equally among the remaining operations. Then, which operation will show the maximum across all companies and all operations?
Answer the following question based on the information given below.
The questions are based on the pie charts given below. Chart 1 shows the distribution of twelve million tons of crude oil transported through different modes over a specific period of time. Chart 2 shows the distribution of the cost of transporting this crude oil. The total cost was Rs. 30 million.
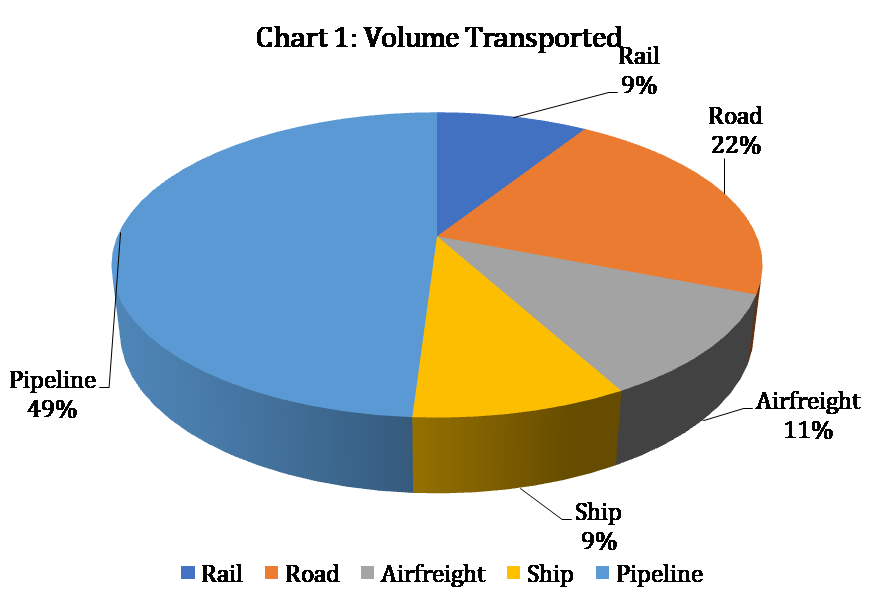

The cost in rupees per ton of oil moved by rail and road happens to be roughly
Answer the following question based on the information given below.
The questions are based on the pie charts given below. Chart 1 shows the distribution of twelve million tons of crude oil transported through different modes over a specific period of time. Chart 2 shows the distribution of the cost of transporting this crude oil. The total cost was Rs. 30 million.
From the charts given, it appears that the cheapest mode of transport is
Answer the following question based on the information given below.
The questions are based on the pie charts given below. Chart 1 shows the distribution of twelve million tons of crude oil transported through different modes over a specific period of time. Chart 2 shows the distribution of the cost of transporting this crude oil. The total cost was Rs. 30 million.
If the costs per ton of transport by ship, air and road are represented by P, Q and R respectively, which of the following is true?
Answer the following question based on the information given below.
Information Technology Industry in India (Figure are in million US dollars)
 âââââââ
The total annual exports lay between 35 and 40 percent of the total annual business of the IT industry, in years
Answer the following question based on the information given below.
Information Technology Industry in India (Figure are in million US dollars)
âââââââ
The highest percentage growth in the total IT business, relative to the previous year was achieved in
Answer the following question based on the information given below.
Information Technology Industry in India (Figure are in million US dollars)
âââââââ
Which one of the following statements is correct?
Answer the following question based on the information given below.
Information Technology Industry in India (Figure are in million US dollars)
âââââââ
For the IT hardware business activity, which one of the following is not true?
Answer the following question based on the information given below.
Information Technology Industry in India (Figure are in million US dollars)
âââââââ
For the two IT business activities, hardware and peripherals, which one of the following is true?
Answer the following question based on the information given below.
Factory Sector by Type of Ownership.
All figures in the table are in percent of the total for the corresponding column.
 âââââââ
Suppose the average employment level is 60 per factory. The average employment in “wholly private” factories is approximately
Answer the following question based on the information given below.
Factory Sector by Type of Ownership.
All figures in the table are in percent of the total for the corresponding column.
âââââââ
Among the firms in different sectors, value added per employee is highest in
Answer the following question based on the information given below.
Factory Sector by Type of Ownership.
All figures in the table are in percent of the total for the corresponding column.
âââââââ
Capital productivity is defined as the gross output value per rupee of fixed capital. The three sectors with the higher capital productivity, arranged in descending order are
Answer the following question based on the information given below.
Factory Sector by Type of Ownership.
All figures in the table are in percent of the total for the corresponding column.
âââââââ
A sector is considered “pareto efficient” if its value added per employee and its value added per rupee of fixed capital is higher than those of all other sectors. Based on the table data, the pareto efficient sector is
Answer the following question based on the information given below.
Factory Sector by Type of Ownership.
All figures in the table are in percent of the total for the corresponding column.
âââââââ
The total value added in all sectors is estimated at Rs. 140,000 crores. Suppose that the number of firms in the joint sector is 2700. The average value added per factory, in Rs. crores, in the central government is
FEI for a country in a year, is the ratio (expressed as a percentage) of its foreign equity inflows to its GDP. The following figure displays the FEIs for select Asian countries for the years 1997 and 1998.

The country with the largest change in FEI in 1998 relative to its FEI in 1997, is
FEI for a country in a year, is the ratio (expressed as a percentage) of its foreign equity inflows to its GDP. The following figure displays the FEIs for select Asian countries for the years 1997 and 1998.
Based on the data provided, it can be concluded that
FEI for a country in a year, is the ratio (expressed as a percentage) of its foreign equity inflows to its GDP. The following figure displays the FEIs for select Asian countries for the years 1997 and 1998.
It is known that China’s GDP in 1998 was 7% higher than its value in 1997, while India's GDP grew by 2% during the same period. The GDP of South Korea, on the other hand, fell by 5%. Which of the following statements is/are true?
- Foreign equity inflows to China were higher in 1998 than in 1997.
- Foreign equity inflows to China were lower in 1998 than in 1997.
- Foreign equity inflows to India were higher in 1998 than in 1997.
- Foreign equity inflows to South Korea decreased in 1998 relative to 1997.
- Foreign equity inflows to South Korea increased in 1998 relative to 1997.
FEI for a country in a year, is the ratio (expressed as a percentage) of its foreign equity inflows to its GDP. The following figure displays the FEIs for select Asian countries for the years 1997 and 1998.
China’s foreign equity inflows in 1998 were 10 times that into India. It can be concluded that
Answer the following question based on the information given below.
The table shows trends in external transactions of Indian corporate sector during the period 1993-94 to 1997-98. In addition, following definitions hold good.
Salesi , Importsi, and Exportsi respectively denote the sales, imports and exports in year i.
Deficit in year i, Deficiti = Importsi – Exportsi.
Deficit Intensity in year i, DIi = Deficiti / Salesi.
Growth rate of deficit intensity in year i, GDIi = (DIi – DIi-1)/DIi-1
Further, note that all imports are classified as either raw material or capital goods.
Trends in External Transactions of Indian Corporate Sector (All figures in %)
 âââââââ
The highest growth rate in deficit intensity was recorded in
Answer the following question based on the information given below.
The table shows trends in external transactions of Indian corporate sector during the period 1993-94 to 1997-98. In addition, following definitions hold good.
Salesi , Importsi, and Exportsi respectively denote the sales, imports and exports in year i.
Deficit in year i, Deficiti = Importsi – Exportsi.
Deficit Intensity in year i, DIi = Deficiti / Salesi.
Growth rate of deficit intensity in year i, GDIi = (DIi – DIi-1)/DIi-1
Further, note that all imports are classified as either raw material or capital goods.
Trends in External Transactions of Indian Corporate Sector (All figures in %)
âââââââ
The value of the highest growth rate in deficit intensity is approximately
Answer the following question based on the information given below.
The table shows trends in external transactions of Indian corporate sector during the period 1993-94 to 1997-98. In addition, following definitions hold good.
Salesi , Importsi, and Exportsi respectively denote the sales, imports and exports in year i.
Deficit in year i, Deficiti = Importsi – Exportsi.
Deficit Intensity in year i, DIi = Deficiti / Salesi.
Growth rate of deficit intensity in year i, GDIi = (DIi – DIi-1)/DIi-1
Further, note that all imports are classified as either raw material or capital goods.
Trends in External Transactions of Indian Corporate Sector (All figures in %)
âââââââ
In 1997-98 the total cost of raw materials is estimated as 50% of sales of that year. The turn over of Gross fixed assets, defined as the ratio of sales to Gross fixed assets, in 1997-98 is, approximately
Answer the following question based on the information given below.
The table shows trends in external transactions of Indian corporate sector during the period 1993-94 to 1997-98. In addition, following definitions hold good.
Salesi , Importsi, and Exportsi respectively denote the sales, imports and exports in year i.
Deficit in year i, Deficiti = Importsi – Exportsi.
Deficit Intensity in year i, DIi = Deficiti / Salesi.
Growth rate of deficit intensity in year i, GDIi = (DIi – DIi-1)/DIi-1
Further, note that all imports are classified as either raw material or capital goods.
Trends in External Transactions of Indian Corporate Sector (All figures in %)
âââââââ
Which of the following statements can be inferred to be true from the given data?
Answer the following question based on the information given below.
The figures below present annual growth rate, expressed as the % change relative to the previous year, in four sectors of the economy of the Republic of Reposia during the 9 year period from 1990 to 1998. Assume that the index of production for each of the four sectors is set at 100 in 1989. Further, the four sectors manufacturing, mining and quarrying, electricity, and chemicals, respectively, constituted 20%. 15%. 10% and 15% of total industrial production in 1989.

Which is the sector with the highest growth during the period 1989 and 1998?
Answer the following question based on the information given below.
The figures below present annual growth rate, expressed as the % change relative to the previous year, in four sectors of the economy of the Republic of Reposia during the 9 year period from 1990 to 1998. Assume that the index of production for each of the four sectors is set at 100 in 1989. Further, the four sectors manufacturing, mining and quarrying, electricity, and chemicals, respectively, constituted 20%. 15%. 10% and 15% of total industrial production in 1989.
The overall growth rate in 1991 of the four sectors together is approximately
Answer the following question based on the information given below.
The figures below present annual growth rate, expressed as the % change relative to the previous year, in four sectors of the economy of the Republic of Reposia during the 9 year period from 1990 to 1998. Assume that the index of production for each of the four sectors is set at 100 in 1989. Further, the four sectors manufacturing, mining and quarrying, electricity, and chemicals, respectively, constituted 20%. 15%. 10% and 15% of total industrial production in 1989.
When was the highest level of production in the manufacturing sector achieved during the nine year period 1990-1998?
Answer the following question based on the information given below.
The figures below present annual growth rate, expressed as the % change relative to the previous year, in four sectors of the economy of the Republic of Reposia during the 9 year period from 1990 to 1998. Assume that the index of production for each of the four sectors is set at 100 in 1989. Further, the four sectors manufacturing, mining and quarrying, electricity, and chemicals, respectively, constituted 20%. 15%. 10% and 15% of total industrial production in 1989.
When was the lowest level of production of the mining and quarrying sector achieved during the nine year period 1990-1998?
Answer the following question based on the information given below.
The figures below present annual growth rate, expressed as the % change relative to the previous year, in four sectors of the economy of the Republic of Reposia during the 9 year period from 1990 to 1998. Assume that the index of production for each of the four sectors is set at 100 in 1989. Further, the four sectors manufacturing, mining and quarrying, electricity, and chemicals, respectively, constituted 20%. 15%. 10% and 15% of total industrial production in 1989.
The percentage increase of production in the four sectors, namely, manufacturing, mining & quarrying, electricity and chemicals, taken together, in 1994, relative to 1989, is approximately
Answer the following question based on the information given below.
The figures below present annual growth rate, expressed as the % change relative to the previous year, in four sectors of the economy of the Republic of Reposia during the 9 year period from 1990 to 1998. Assume that the index of production for each of the four sectors is set at 100 in 1989. Further, the four sectors manufacturing, mining and quarrying, electricity, and chemicals, respectively, constituted 20%. 15%. 10% and 15% of total industrial production in 1989.
It is known that the index of total industrial production in 1994 was 50 percent more that in 1989. Then, the percentage increase in production between 1989 and 1994 in sectors other than the four listed above is
Answer the following question based on the information given below.
ABC Ltd. produces widgets for which the demand is unlimited and they can sell all of their production. The graph below describes the monthly variable costs incurred by the company as a function of the quantity produced. In addition, operating the plant for one shift results in a fixed monthly cost of Rs. 800. Fixed monthly costs for second shift operation are estimated at Rs. 1200. Each shift operation provides capacity for producing 30 widgets per month.
Note : Average unit cost, AC = Total monthly costs/monthly production, and
Marginal cost, MC is the rate of change in total cost for unit change in quantity produced.

Total production in July is 40 units. What is the approximate average unit cost for July?
Answer the following question based on the information given below.
ABC Ltd. produces widgets for which the demand is unlimited and they can sell all of their production. The graph below describes the monthly variable costs incurred by the company as a function of the quantity produced. In addition, operating the plant for one shift results in a fixed monthly cost of Rs. 800. Fixed monthly costs for second shift operation are estimated at Rs. 1200. Each shift operation provides capacity for producing 30 widgets per month.
Note : Average unit cost, AC = Total monthly costs/monthly production, and
Marginal cost, MC is the rate of change in total cost for unit change in quantity produced.
ABC Ltd. is considering increasing the production level. What is the approximate marginal cost of increasing production from its July level of 40 units?
Answer the following question based on the information given below.
ABC Ltd. produces widgets for which the demand is unlimited and they can sell all of their production. The graph below describes the monthly variable costs incurred by the company as a function of the quantity produced. In addition, operating the plant for one shift results in a fixed monthly cost of Rs. 800. Fixed monthly costs for second shift operation are estimated at Rs. 1200. Each shift operation provides capacity for producing 30 widgets per month.
Note : Average unit cost, AC = Total monthly costs/monthly production, and
Marginal cost, MC is the rate of change in total cost for unit change in quantity produced.
From the data provided it can be inferred that, for production levels in the range of 0 to 60 units.
Answer the following question based on the information given below.
ABC Ltd. produces widgets for which the demand is unlimited and they can sell all of their production. The graph below describes the monthly variable costs incurred by the company as a function of the quantity produced. In addition, operating the plant for one shift results in a fixed monthly cost of Rs. 800. Fixed monthly costs for second shift operation are estimated at Rs. 1200. Each shift operation provides capacity for producing 30 widgets per month.
Note : Average unit cost, AC = Total monthly costs/monthly production, and
Marginal cost, MC is the rate of change in total cost for unit change in quantity produced.
Suppose that each widget sells for Rs 150. What is the profit earned by ABC Ltd. in July? (Profit is defined as the excess of sales revenue over total cost.)
Answer the following question based on the information given below.
ABC Ltd. produces widgets for which the demand is unlimited and they can sell all of their production. The graph below describes the monthly variable costs incurred by the company as a function of the quantity produced. In addition, operating the plant for one shift results in a fixed monthly cost of Rs. 800. Fixed monthly costs for second shift operation are estimated at Rs. 1200. Each shift operation provides capacity for producing 30 widgets per month.
Note : Average unit cost, AC = Total monthly costs/monthly production, and
Marginal cost, MC is the rate of change in total cost for unit change in quantity produced.
Assume that the unit price is Rs. 150 and profit is defined as the excess of sales revenue over total costs. What is the monthly production level of ABC Ltd. at which the profit is highest?
Answer the following question based on the information given below.
ABC Ltd. produces widgets for which the demand is unlimited and they can sell all of their production. The graph below describes the monthly variable costs incurred by the company as a function of the quantity produced. In addition, operating the plant for one shift results in a fixed monthly cost of Rs. 800. Fixed monthly costs for second shift operation are estimated at Rs. 1200. Each shift operation provides capacity for producing 30 widgets per month.
Note : Average unit cost, AC = Total monthly costs/monthly production, and
Marginal cost, MC is the rate of change in total cost for unit change in quantity produced.
For monthly production level in the range of 0 to 30 units
Directions: Answer the questions based on the following information.
The figure below represents sales and net profit in Rs. crore of IVP Ltd. for five years from 1994-95 to 1998-99. During this period the sales increased from Rs. 100 crore to Rs. 680 crore. Correspondingly, the net profit increased from Rs. 2.5 crore to Rs. 12 crore. Net profit is defined as the excess of sales over total costs.
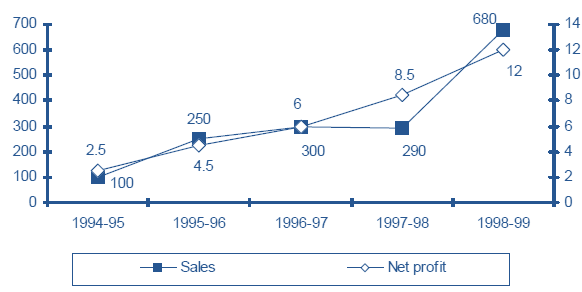
The highest percentage of growth in sales, relative to the previous year, occurred in
Directions: Answer the questions based on the following information.
The figure below represents sales and net profit in Rs. crore of IVP Ltd. for five years from 1994-95 to 1998-99. During this period the sales increased from Rs. 100 crore to Rs. 680 crore. Correspondingly, the net profit increased from Rs. 2.5 crore to Rs. 12 crore. Net profit is defined as the excess of sales over total costs.
The highest percentage growth in net profit, relative to the previous year, was achieved in
Directions: Answer the questions based on the following information.
The figure below represents sales and net profit in Rs. crore of IVP Ltd. for five years from 1994-95 to 1998-99. During this period the sales increased from Rs. 100 crore to Rs. 680 crore. Correspondingly, the net profit increased from Rs. 2.5 crore to Rs. 12 crore. Net profit is defined as the excess of sales over total costs.
Defining profitability as the ratio of net profit to sales, IVP Ltd., recorded the highest profitability in
Directions: Answer the questions based on the following information.
The figure below represents sales and net profit in Rs. crore of IVP Ltd. for five years from 1994-95 to 1998-99. During this period the sales increased from Rs. 100 crore to Rs. 680 crore. Correspondingly, the net profit increased from Rs. 2.5 crore to Rs. 12 crore. Net profit is defined as the excess of sales over total costs.
With profitability as defined in question 137, it can be concluded that
Directions: Answer the questions based on the following information
Consider the information provided in the figure below relating to India’s foreign trade in 1997-98 and the first eight months of 1998-99. Total trade with a region is defined as the sum of exports and imports from that region. Trade deficit is defined as the excess of imports over exports. Trade deficit may be negative.
A.USA G. Other East European countries
B. Germany H. OPEC
C. Other EU I. Asia
D.UK J. Other LDCs
E. Japan K. Others
F. Russia
| Source of Imports | |
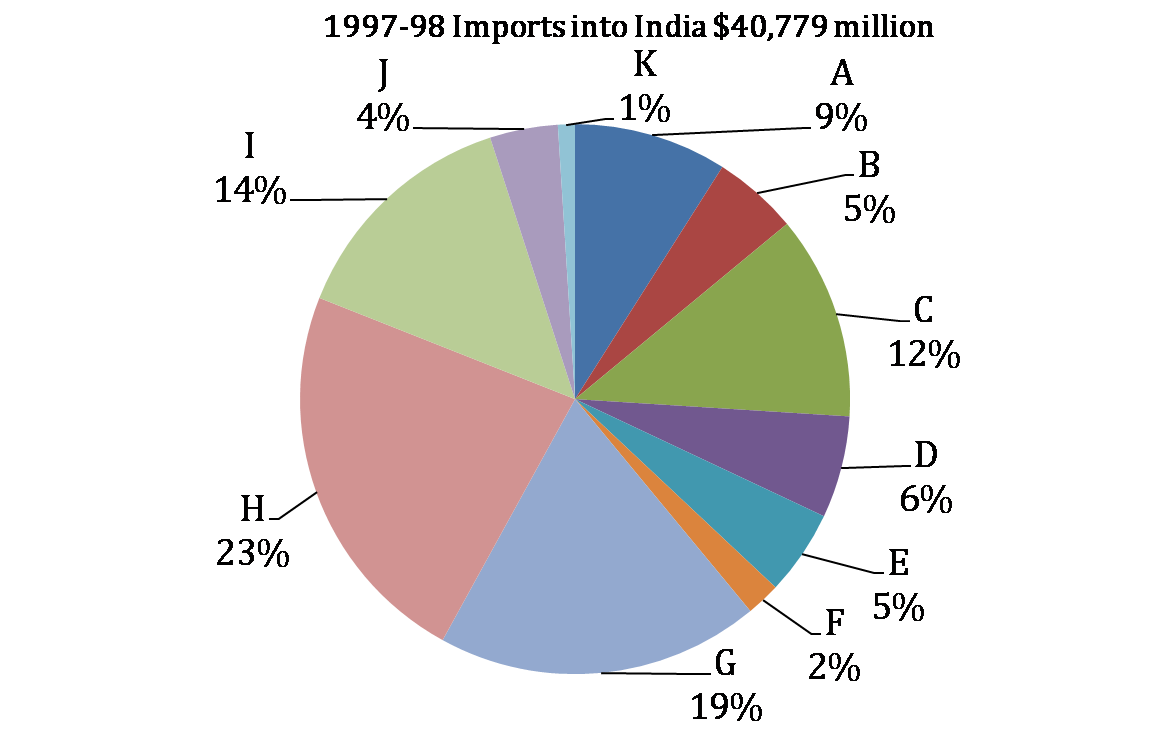 |
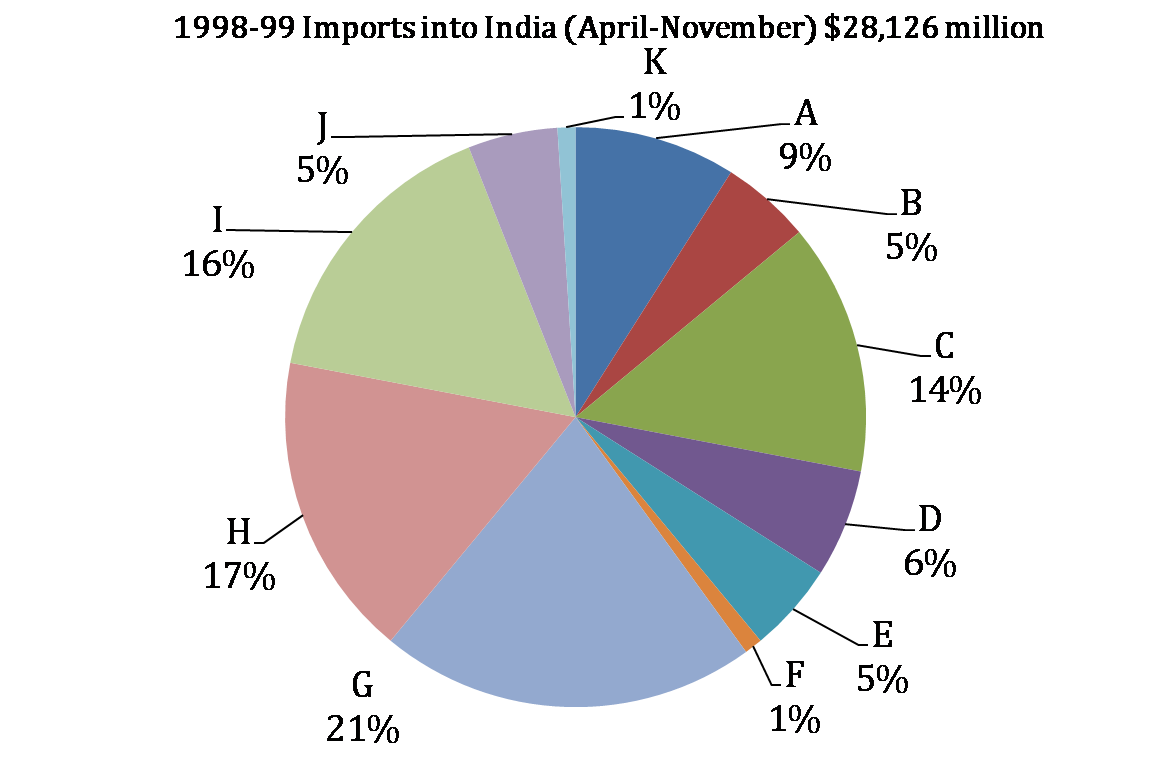 |
| Destination of exports | |
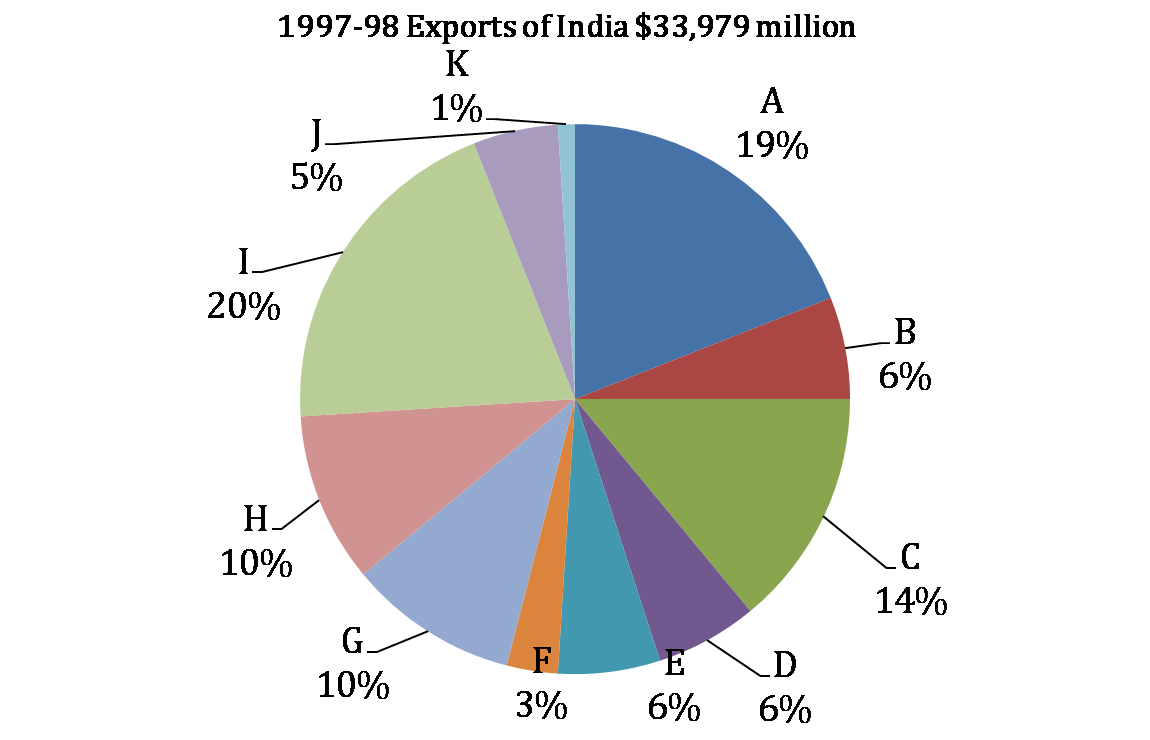 |
 |
What is the region with which India had the highest total trade in 1997-98?
Directions: Answer the questions based on the following information
Consider the information provided in the figure below relating to India’s foreign trade in 1997-98 and the first eight months of 1998-99. Total trade with a region is defined as the sum of exports and imports from that region. Trade deficit is defined as the excess of imports over exports. Trade deficit may be negative.
A.USA G. Other East European countries
B. Germany H. OPEC
C. Other EU I. Asia
D.UK J. Other LDCs
E. Japan K. Others
F. Russia
| Source of Imports | |
|
|
| Destination of exports | |
|
|
In 1997-98 the amount of Indian exports, million US dollars, to the region with which India had the lowest total trade, is approximately
Directions: Answer the questions based on the following information
Consider the information provided in the figure below relating to India’s foreign trade in 1997-98 and the first eight months of 1998-99. Total trade with a region is defined as the sum of exports and imports from that region. Trade deficit is defined as the excess of imports over exports. Trade deficit may be negative.
A.USA G. Other East European countries
B. Germany H. OPEC
C. Other EU I. Asia
D.UK J. Other LDCs
E. Japan K. Others
F. Russia
| Source of Imports | |
|
|
| Destination of exports | |
|
|
In 1997-98, the trade deficit with respect to India, billion US dollars, for the region with the highest trade deficit with respect to India, is approximately equal to
Directions: Answer the questions based on the following information
Consider the information provided in the figure below relating to India’s foreign trade in 1997-98 and the first eight months of 1998-99. Total trade with a region is defined as the sum of exports and imports from that region. Trade deficit is defined as the excess of imports over exports. Trade deficit may be negative.
A.USA G. Other East European countries
B. Germany H. OPEC
C. Other EU I. Asia
D.UK J. Other LDCs
E. Japan K. Others
F. Russia
| Source of Imports | |
|
|
| Destination of exports | |
|
|
What is the region with the lowest trade deficit with India in 1997-98?
Directions: Answer the questions based on the following information
Consider the information provided in the figure below relating to India’s foreign trade in 1997-98 and the first eight months of 1998-99. Total trade with a region is defined as the sum of exports and imports from that region. Trade deficit is defined as the excess of imports over exports. Trade deficit may be negative.
A.USA G. Other East European countries
B. Germany H. OPEC
C. Other EU I. Asia
D.UK J. Other LDCs
E. Japan K. Others
F. Russia
| Source of Imports | |
|
|
| Destination of exports | |
|
|
Additional directions: Assume that the average monthly exports from India and imports to India during the remaining four months of 1998-99 would be the same as that for the first eight months of the year.
What is the region to which India’s exports registered the highest percentage growth between 1997-98 and 1998-99?
Directions: Answer the questions based on the following information
Consider the information provided in the figure below relating to India’s foreign trade in 1997-98 and the first eight months of 1998-99. Total trade with a region is defined as the sum of exports and imports from that region. Trade deficit is defined as the excess of imports over exports. Trade deficit may be negative.
A.USA G. Other East European countries
B. Germany H. OPEC
C. Other EU I. Asia
D.UK J. Other LDCs
E. Japan K. Others
F. Russia
| Source of Imports | |
|
|
| Destination of exports | |
|
|
Additional directions: Assume that the average monthly exports from India and imports to India during the remaining four months of 1998-99 would be the same as that for the first eight months of the year.
What is the percentage growth rate in India’s total trade deficit between 1997-98 and 1998-99?
Directions: Answer the questions based on the following information.
These questions are based on the price fluctuations of four commodities — arhar, pepper, sugar and gold during February-July 1999 as described in the figures below.
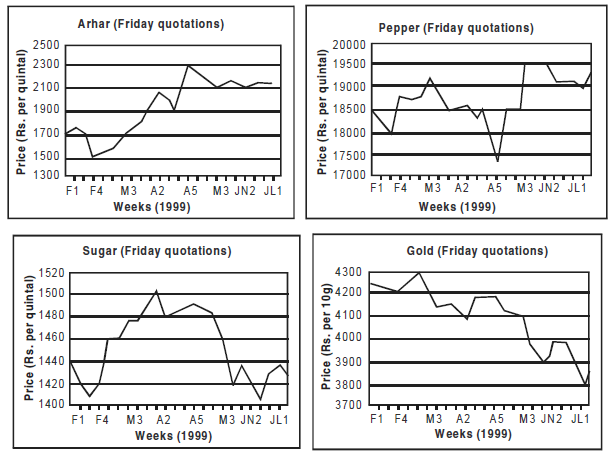
Price change of a commodity is defined as the absolute difference in ending and beginning prices expressed as a percentage of the beginning. What is the commodity with the highest price change?
Directions: Answer the questions based on the following information.
These questions are based on the price fluctuations of four commodities — arhar, pepper, sugar and gold during February-July 1999 as described in the figures below.
Price volatility (PV) of a commodity is defined as follows:
PV = (Highest price during the period – Lowest price during the period)/Average price during the period. What is the commodity with the lowest price volatility?
Directions: Answer the questions based on the following information.
These questions are based on the price fluctuations of four commodities — arhar, pepper, sugar and gold during February-July 1999 as described in the figures below.
Mr X, a fund manager with an investment company invested 25% of his funds in each of the four commodities at the beginning of the period. He sold the commodities at the end of the period. His investments in the commodities resulted in
Directions: Answer the questions based on the following information.
These questions are based on the price fluctuations of four commodities — arhar, pepper, sugar and gold during February-July 1999 as described in the figures below.
The price volatility(PV) of the commodity with the highest PV during the February-July period is approximately equal to
Directions: Answer the questions based on the following information.
The table below presents data on percentage population covered by drinking water and sanitation facilities in selected Asian countries.
 âââââââ
Country A is said to dominate B or A > B if A has higher percentage in total coverage for both drinking water and sanitation facilities, and, B is said to be dominated by A, or B < A.
A country is said to be on the coverage frontier if no other country dominates it. Similarly, a country is not on the coverage frontier if it is dominated by at least one other country.
Which countries are the countries on the coverage frontier?
Directions: Answer the questions based on the following information.
The table below presents data on percentage population covered by drinking water and sanitation facilities in selected Asian countries.
âââââââ
Country A is said to dominate B or A > B if A has higher percentage in total coverage for both drinking water and sanitation facilities, and, B is said to be dominated by A, or B < A.
A country is said to be on the coverage frontier if no other country dominates it. Similarly, a country is not on the coverage frontier if it is dominated by at least one other country.
Which of the following statements are true?
A. India > Pakistan and India > Indonesia
B. India > China and India > Nepal
C. Sri Lanka > China D. China > Nepal
Directions: Answer the questions based on the following information.
The table below presents data on percentage population covered by drinking water and sanitation facilities in selected Asian countries.
âââââââ
Country A is said to dominate B or A > B if A has higher percentage in total coverage for both drinking water and sanitation facilities, and, B is said to be dominated by A, or B < A.
A country is said to be on the coverage frontier if no other country dominates it. Similarly, a country is not on the coverage frontier if it is dominated by at least one other country.
Using only the data presented under ‘sanitation facilities’ columns, it can be concluded that rural population in India, as a percentage of its total population is approximately
Directions: Answer the questions based on the following information.
The table below presents data on percentage population covered by drinking water and sanitation facilities in selected Asian countries.
âââââââ
Country A is said to dominate B or A > B if A has higher percentage in total coverage for both drinking water and sanitation facilities, and, B is said to be dominated by A, or B < A.
A country is said to be on the coverage frontier if no other country dominates it. Similarly, a country is not on the coverage frontier if it is dominated by at least one other country.
Again, using only the data presented under ‘sanitation facilities’ columns, sequence China, Indonesia and Philippines in ascending order of rural population as a percentage of their respective total population. The correct order is
Directions: Answer the questions based on the following information.
The table below presents data on percentage population covered by drinking water and sanitation facilities in selected Asian countries.
âââââââ
Country A is said to dominate B or A > B if A has higher percentage in total coverage for both drinking water and sanitation facilities, and, B is said to be dominated by A, or B < A.
A country is said to be on the coverage frontier if no other country dominates it. Similarly, a country is not on the coverage frontier if it is dominated by at least one other country.
India is not on the coverage frontier because
A. it is lower than Bangladesh in terms of coverage of drinking water facilities.
B. it is lower than Sri Lanka in terms of coverage of sanitation facilities.
C. it is lower than Pakistan in terms of coverage of sanitation facilities.
D. it is dominated by Indonesia.
Directions: Answer the questions based on the following information.
The table below presents data on percentage population covered by drinking water and sanitation facilities in selected Asian countries.
âââââââ
Country A is said to dominate B or A > B if A has higher percentage in total coverage for both drinking water and sanitation facilities, and, B is said to be dominated by A, or B < A.
A country is said to be on the coverage frontier if no other country dominates it. Similarly, a country is not on the coverage frontier if it is dominated by at least one other country.
Additional direction: These relate to the above table with the additional provision that the gap between the population coverages of ‘sanitation facilities’ and ‘drinking water facilities’ is a measure of disparity in coverage.
The country with the most disparity in coverage of rural sector is
Directions: Answer the questions based on the following information.
The table below presents data on percentage population covered by drinking water and sanitation facilities in selected Asian countries.
âââââââ
Country A is said to dominate B or A > B if A has higher percentage in total coverage for both drinking water and sanitation facilities, and, B is said to be dominated by A, or B < A.
A country is said to be on the coverage frontier if no other country dominates it. Similarly, a country is not on the coverage frontier if it is dominated by at least one other country.
Additional direction: These relate to the above table with the additional provision that the gap between the population coverages of ‘sanitation facilities’ and ‘drinking water facilities’ is a measure of disparity in coverage.
The country with the least disparity in coverage of urban sector is
Direction: The following table gives the quantity of apples (in tonnes) arriving at
New Delhi market from various states in a particular year. The month in which demand was more than supply, the additional demand was met by the stock from cold storage.
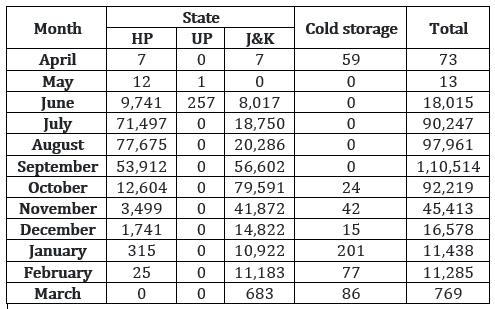 âââââââ
What was the maximum percentage of apples supplied by any state in any of the months?
Direction: The following table gives the quantity of apples (in tonnes) arriving at
New Delhi market from various states in a particular year. The month in which demand was more than supply, the additional demand was met by the stock from cold storage.
âââââââ
Which state supplied the maximum number of apples?
Direction: The following table gives the quantity of apples (in tonnes) arriving at
New Delhi market from various states in a particular year. The month in which demand was more than supply, the additional demand was met by the stock from cold storage.
âââââââ
Which state supplied the highest percentage of apples from the total apples supplied?
Direction: The following table gives the quantity of apples (in tonnes) arriving at
New Delhi market from various states in a particular year. The month in which demand was more than supply, the additional demand was met by the stock from cold storage.
âââââââ
In which of the following periods was the supply greater than the demand?
Direction: The following table gives the quantity of apples (in tonnes) arriving at
New Delhi market from various states in a particular year. The month in which demand was more than supply, the additional demand was met by the stock from cold storage.
âââââââ
If the yield per tree was 40 kg, then from how many trees were the apples supplied to New Delhi (in millions) during the year?
Direction: The following table gives the quantity of apples (in tonnes) arriving at
New Delhi market from various states in a particular year. The month in which demand was more than supply, the additional demand was met by the stock from cold storage.
âââââââ
Using the data in previous question, if there were 250 trees per hectare, then how many hectares of land was used?
Direction: Answer the questions based on the following information.
The following bar chart gives the growth percentage in the number of households in middle, upper-middle and high income categories in the four regions for the period between 1987-88 and 1994-95.
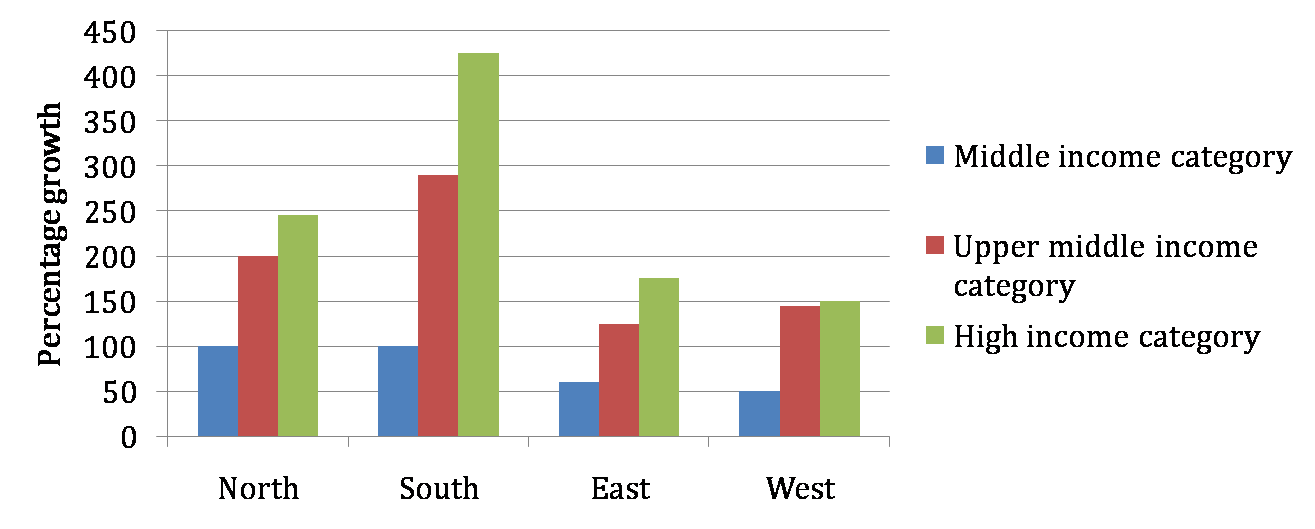
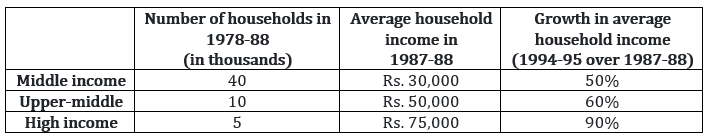 âââââââ
Which region showed the highest growth in number of households in all the income categories for the period?
Direction: Answer the questions based on the following information.
The following bar chart gives the growth percentage in the number of households in middle, upper-middle and high income categories in the four regions for the period between 1987-88 and 1994-95.
âââââââ
What was the total household income in northern region for upper-middle class?
Direction: Answer the questions based on the following information.
The following bar chart gives the growth percentage in the number of households in middle, upper-middle and high income categories in the four regions for the period between 1987-88 and 1994-95.
âââââââ
What is the percentage increase in total number of households for the northern region (upper-middle) over the given period?
Direction: Answer the questions based on the following information.
The following bar chart gives the growth percentage in the number of households in middle, upper-middle and high income categories in the four regions for the period between 1987-88 and 1994-95.
âââââââ
What was the average income of the high-income group in 1987-88?
Direction: Answer the questions based on the following information.
The following bar chart gives the growth percentage in the number of households in middle, upper-middle and high income categories in the four regions for the period between 1987-88 and 1994-95.
âââââââ
Additional direction: The numbers of households in each category were equally distributed in all the regions.
The ratio of total income for the high-income category to the upper-middle class increased by how much percentage in the given period?
Direction: Answer the questions based on the following information.
The following bar chart gives the growth percentage in the number of households in middle, upper-middle and high income categories in the four regions for the period between 1987-88 and 1994-95.
âââââââ
Additional direction: The numbers of households in each category were equally distributed in all the regions.
The average income for the northern region in 1987-88 was
Direction: Answer the questions based on the following information.
Krishna distributed 10-acre land to Gopal and Ram who paid him the total amount in the ratio 2 : 3. Gopal invested a further Rs. 2 lakh in the land and planted coconut and lemon trees in the ratio 5 : 1 on equal areas of land. There were a total of 100 lemon trees. The cost of one coconut was Rs. 5. The crop took 7 years to mature and when the crop was reaped in 1997, the total revenue generated was 25% of the total amount put in by Gopal and Ram together. The revenue generated from the coconut and lemon trees was in the ratio 3 : 2 and it was shared equally by Gopal and Ram as the initial amount spent by them were equal.
What was the total output of coconuts?
Direction: Answer the questions based on the following information.
Krishna distributed 10-acre land to Gopal and Ram who paid him the total amount in the ratio 2 : 3. Gopal invested a further Rs. 2 lakh in the land and planted coconut and lemon trees in the ratio 5 : 1 on equal areas of land. There were a total of 100 lemon trees. The cost of one coconut was Rs. 5. The crop took 7 years to mature and when the crop was reaped in 1997, the total revenue generated was 25% of the total amount put in by Gopal and Ram together. The revenue generated from the coconut and lemon trees was in the ratio 3 : 2 and it was shared equally by Gopal and Ram as the initial amount spent by them were equal.
What was the value of output per acre of lemon trees planted?
Direction: Answer the questions based on the following information.
Krishna distributed 10-acre land to Gopal and Ram who paid him the total amount in the ratio 2 : 3. Gopal invested a further Rs. 2 lakh in the land and planted coconut and lemon trees in the ratio 5 : 1 on equal areas of land. There were a total of 100 lemon trees. The cost of one coconut was Rs. 5. The crop took 7 years to mature and when the crop was reaped in 1997, the total revenue generated was 25% of the total amount put in by Gopal and Ram together. The revenue generated from the coconut and lemon trees was in the ratio 3 : 2 and it was shared equally by Gopal and Ram as the initial amount spent by them were equal.
What was the amount received by Gopal in 1997?
Direction: Answer the questions based on the following information.
Krishna distributed 10-acre land to Gopal and Ram who paid him the total amount in the ratio 2 : 3. Gopal invested a further Rs. 2 lakh in the land and planted coconut and lemon trees in the ratio 5 : 1 on equal areas of land. There were a total of 100 lemon trees. The cost of one coconut was Rs. 5. The crop took 7 years to mature and when the crop was reaped in 1997, the total revenue generated was 25% of the total amount put in by Gopal and Ram together. The revenue generated from the coconut and lemon trees was in the ratio 3 : 2 and it was shared equally by Gopal and Ram as the initial amount spent by them were equal.
What was the value of output per tree for coconuts?
Direction: Answer the questions based on the following information.
Krishna distributed 10-acre land to Gopal and Ram who paid him the total amount in the ratio 2 : 3. Gopal invested a further Rs. 2 lakh in the land and planted coconut and lemon trees in the ratio 5 : 1 on equal areas of land. There were a total of 100 lemon trees. The cost of one coconut was Rs. 5. The crop took 7 years to mature and when the crop was reaped in 1997, the total revenue generated was 25% of the total amount put in by Gopal and Ram together. The revenue generated from the coconut and lemon trees was in the ratio 3 : 2 and it was shared equally by Gopal and Ram as the initial amount spent by them were equal.
What was the ratio of yields per acre of land for coconuts and lemons (in terms of number of lemons and coconuts)?
Direction: Answer the questions based on the following information.
Ghosh Babu has a manufacturing unit. The following graph gives the cost for various number of units. Given: Profit = Revenue – Variable cost – Fixed cost. The fixed cost remains constant up to 34 units after which additional investment is to be done in fixed assets. In any case, production cannot exceed 50 units.
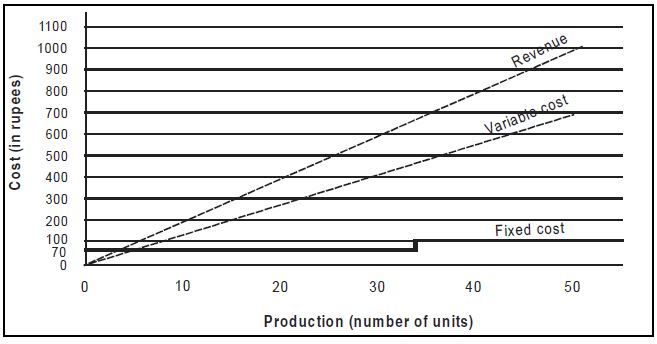
What is the minimum number of units that need to be produced to make sure that there was no loss?
Direction: Answer the questions based on the following information.
Ghosh Babu has a manufacturing unit. The following graph gives the cost for various number of units. Given: Profit = Revenue – Variable cost – Fixed cost. The fixed cost remains constant up to 34 units after which additional investment is to be done in fixed assets. In any case, production cannot exceed 50 units.
How many units should be manufactured such that the profit was at least Rs. 50?
Direction: Answer the questions based on the following information.
Ghosh Babu has a manufacturing unit. The following graph gives the cost for various number of units. Given: Profit = Revenue – Variable cost – Fixed cost. The fixed cost remains constant up to 34 units after which additional investment is to be done in fixed assets. In any case, production cannot exceed 50 units.
If at the most 40 units can be manufactured, then what is the number of units that can be manufactured to maximise profit per unit?
Direction: Answer the questions based on the following information.
Ghosh Babu has a manufacturing unit. The following graph gives the cost for various number of units. Given: Profit = Revenue – Variable cost – Fixed cost. The fixed cost remains constant up to 34 units after which additional investment is to be done in fixed assets. In any case, production cannot exceed 50 units.
If the production cannot exceed 45 units, then what is the number of units that can maximise profit per unit?
Direction: Answer the questions based on the following information.
Ghosh Babu has a manufacturing unit. The following graph gives the cost for various number of units. Given: Profit = Revenue – Variable cost – Fixed cost. The fixed cost remains constant up to 34 units after which additional investment is to be done in fixed assets. In any case, production cannot exceed 50 units.
If the fixed cost of production goes up by Rs. 40, then what is the minimum number of units that need to be manufactured to make sure that there is no loss?
Direction: Answer the questions based on the following information.
In the following chart, the price of logs shown is per cubic metre that of plywood and saw timber is per tonne.
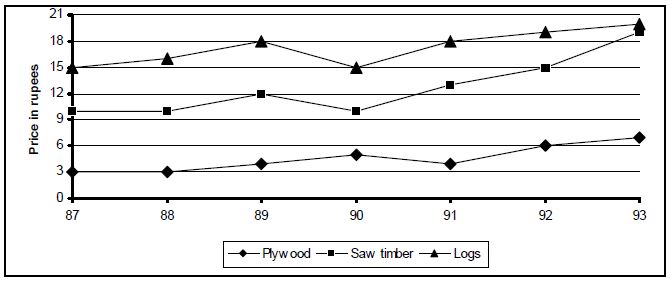
What is the maximum percentage increase in price per cubic metre or per tonne over the previous year?
Direction: Answer the questions based on the following information.
In the following chart, the price of logs shown is per cubic metre that of plywood and saw timber is per tonne.
Which product shows the maximum percentage increase in price over the period?
Direction: Answer the questions based on the following information.
In the following chart, the price of logs shown is per cubic metre that of plywood and saw timber is per tonne.
If 1 m3 = 750 kg for saw timber, find in which year was the difference in prices of saw timber and logs the least?
Direction: Answer the questions based on the following information.
In the following chart, the price of logs shown is per cubic metre that of plywood and saw timber is per tonne.
If one cubic metre = 700 kg for plywood and 800 kg for saw timber, find in which year was the difference in the prices of plywood and saw timber (per cubic metre) the maximum?
Direction: Answer the questions based on the following information.
In the following chart, the price of logs shown is per cubic metre that of plywood and saw timber is per tonne.
If the volume sales of plywood, saw timber and logs were 40%, 30% and 30% respectively, then what was the average realisation in 1993 per cubic metre of sales? (Weight of one cubic metre of saw dust and plywood both = 800 kg)
Direction: Answer the questions based on the following information.
In the following chart, the price of logs shown is per cubic metre that of plywood and saw timber is per tonne.
In the previous question, if in 1994, prices increased by 5%, 1% and 10% while the volume sales break-up was 40%, 30% and 30% for plywood, saw timber and logs respectively, then what was the average realisation?
Direction: Answer the questions based on the following table.
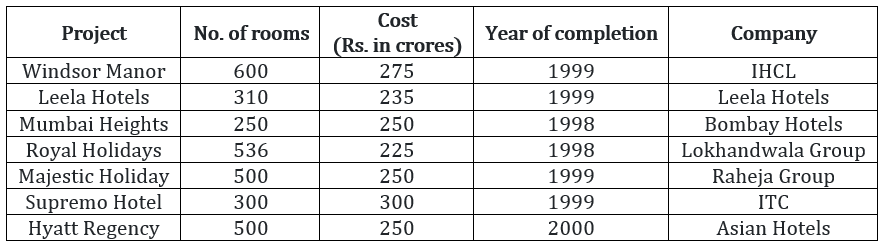 ââââââââââââââ
âââââââNote: All projects start in 1997.
Which of the following had the least cost per room?
Direction: Answer the questions based on the following table.
ââââââââââââââ
âââââââNote: All projects start in 1997.
Which of the following has the maximum number of rooms per crore of rupees?
Direction: Answer the questions based on the following table.
ââââââââââââââ
âââââââNote: All projects start in 1997.
Additional direction: Assume that the cost of the project is incurred in the year of completion; interest is charged at the rate of 10% per annum.
What is the cost incurred for projects completed in 1998?
Direction: Answer the questions based on the following table.
ââââââââââââââ
âââââââNote: All projects start in 1997.
Additional direction: Assume that the cost of the project is incurred in the year of completion; interest is charged at the rate of 10% per annum.
What is the cost incurred for projects completed in 1999?
Direction: Answer the questions based on the following table.
ââââââââââââââ
âââââââNote: All projects start in 1997.
Additional direction: Assume that the cost of the project is incurred in the year of completion; interest is charged at the rate of 10% per annum.
What is the approximate cost incurred for projects completed by 2000?
Direction: Answer the questions based on the following graph.
The graph given below shows the quantity of milk and food grains consumed annually along with female and male population (in millions). Use the data to answer the questions that follow.
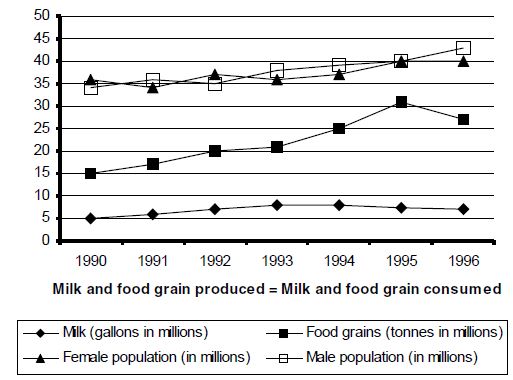
When was the per capita production of milk least?
Direction: Answer the questions based on the following graph.
The graph given below shows the quantity of milk and food grains consumed annually along with female and male population (in millions). Use the data to answer the questions that follow.
When was the per capita production of foodgrains most?
Direction: Answer the questions based on the following graph.
The graph given below shows the quantity of milk and food grains consumed annually along with female and male population (in millions). Use the data to answer the questions that follow.
In which year was the difference between the percentage increase in the production of foodgrains and milk maximum?
Direction: Answer the questions based on the following graph.
The graph given below shows the quantity of milk and food grains consumed annually along with female and male population (in millions). Use the data to answer the questions that follow.
If milk contains 320 calories and foodgrains contain 160 calories, in which year was the per capita consumption of calories highest?
Direction: Answer the questions based on the following graph.
The graph given below shows the quantity of milk and food grains consumed annually along with female and male population (in millions). Use the data to answer the questions that follow.
If one gallon milk contains 120 g of a particular nutrient and one tonne of foodgrains contains 80 g of the same nutrient, in which year was the availability of this nutrient maximum?
Direction: Answer the questions based on the following graph.
The graph given below shows the quantity of milk and food grains consumed annually along with female and male population (in millions). Use the data to answer the questions that follow.
Referring to the above question, in which year was the per capita consumption of this nutrient highest?
Direction: Answer the questions based on the following graph.
The graph given below gives the yearly details of money invested in producing a certain product over the years 1991 to 1995. It also gives the profit (in ‘000 rupees).
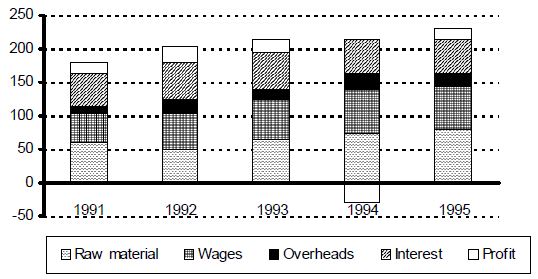
In which year was the increase in raw material maximum?
Direction: Answer the questions based on the following graph.
The graph given below gives the yearly details of money invested in producing a certain product over the years 1991 to 1995. It also gives the profit (in ‘000 rupees).
In which period was the change in profit maximum?
Direction: Answer the questions based on the following graph.
The graph given below gives the yearly details of money invested in producing a certain product over the years 1991 to 1995. It also gives the profit (in ‘000 rupees).
Which component of the cost production has remained more or less constant over the period?
Direction: Answer the questions based on the following graph.
The graph given below gives the yearly details of money invested in producing a certain product over the years 1991 to 1995. It also gives the profit (in ‘000 rupees).
In which year were the overheads, as a percentage of the raw material, maximum?
Direction: Answer the questions based on the following graph.
The graph given below gives the yearly details of money invested in producing a certain product over the years 1991 to 1995. It also gives the profit (in ‘000 rupees).
What percentage of the costs did the profits form over the period?
Direction: Answer the questions based on the following graph.
The graph given below gives the yearly details of money invested in producing a certain product over the years 1991 to 1995. It also gives the profit (in ‘000 rupees).
If the interest component is not included in the total cost calculation, which year would show the maximum profit per unit cost?
Direction: Answer the questions based on the following information.
The following table gives the tariff [in paise per kilo-watt-hour (kWh)] levied by the UPSEB in 1994-95, in four sectors and the regions within them. The table also gives the percentage change in the tariff as compared to 1991-92.
 ââââââââââââââ
If the amount of power consumed by the various regions in sector 1 is the same, then as compared to 1991-92 the net tariff in 1994-95
Direction: Answer the questions based on the following information.
The following table gives the tariff [in paise per kilo-watt-hour (kWh)] levied by the UPSEB in 1994-95, in four sectors and the regions within them. The table also gives the percentage change in the tariff as compared to 1991-92.
ââââââââââââââ
What was the approximate average tariff in region 3 in 1991-92?
Additional direction: The UPSEB supplies power under four categories: urban (25%), domestic (20%), industrial (40%) and rural (15%). In 1994-95, the total power produced by the UPSEB was, 7875 megawatts.
In 1994-95, if there was 10% decrease in the domestic consumption of power as compared to that in 1991-92, what was the consumption of power in the rural sector in 1991-92?
Additional direction: The UPSEB supplies power under four categories: urban (25%), domestic (20%), industrial (40%) and rural (15%). In 1994-95, the total power produced by the UPSEB was, 7875 megawatts.
In the given 2 years, what is the total tariff paid by the urban sector?
Additional direction: The UPSEB supplies power under four categories: urban (25%), domestic (20%), industrial (40%) and rural (15%). In 1994-95, the total power produced by the UPSEB was, 7875 megawatts.
Which of the following statements is true?
Direction: Answer the questions based on the following table.
The table given below gives the annual details of loans from rural banks and agricultural loans over the years 1970 to 1983. Using this data answer the questions that follow.
 ââââââââââââââ
In 1974, the amount of agricultural loans formed what percentage of the total loans?
Direction: Answer the questions based on the following table.
The table given below gives the annual details of loans from rural banks and agricultural loans over the years 1970 to 1983. Using this data answer the questions that follow.
ââââââââââââââ
From the given data, the number of rural loans up to 1980 formed approximately what percentage of those in 1983?
Direction: Answer the questions based on the following table.
The table given below gives the annual details of loans from rural banks and agricultural loans over the years 1970 to 1983. Using this data answer the questions that follow.
ââââââââââââââ
Which of the following pairs of years showed the maximum increase in the number of rural bank loans?
Direction: Answer the questions based on the following table.
The table given below gives the annual details of loans from rural banks and agricultural loans over the years 1970 to 1983. Using this data answer the questions that follow.
ââââââââââââââ
What is the value of the agricultural loans in 1983 at 1970 prices?
Direction: Answer the questions based on the following table.
The table given below gives the annual details of loans from rural banks and agricultural loans over the years 1970 to 1983. Using this data answer the questions that follow.
ââââââââââââââ
In which year was the number of rural bank loans per rural bank least?
Direction: Answer the questions based on the following table.
The table given below gives the annual details of loans from rural banks and agricultural loans over the years 1970 to 1983. Using this data answer the questions that follow.
ââââââââââââââ
What is the simple annual rate of increase in the number of agricultural loans from 1970 to 1983?
Additional direction: If the consumer price index for 1970 is to be taken as 105 and the indices for the subsequent years are to be corrected accordingly, then answer 184 and 185.
By roughly how many points do the indices for 1983 and 1975 differ?
Additional direction: If the consumer price index for 1970 is to be taken as 105 and the indices for the subsequent years are to be corrected accordingly, then answer 184 and 185.
What is the value of the loans in 1980 at 1983 prices?
Direction: Answer the questions based on the following information.
The data given in the table shows the investment details in country ‘Fortune Land’ of companies A, B, C, D, E and F. Figures in the table are in US dollars in billions.
âââââââ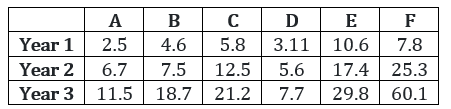 ââ
ââ
What is the percentage increase in investment of B, C, D and E from year 1 to year 3?
Direction: Answer the questions based on the following information.
The data given in the table shows the investment details in country ‘Fortune Land’ of companies A, B, C, D, E and F. Figures in the table are in US dollars in billions.
âââââââââ
What is the ratio of investments of E to F for the years 1 to 3?
Direction: Answer the questions based on the following information.
The data given in the table shows the investment details in country ‘Fortune Land’ of companies A, B, C, D, E and F. Figures in the table are in US dollars in billions.
âââââââââ
What is D’s contribution as a percentage of total investments in year 2?
Direction: Answer the questions based on the following information.
The data given in the table shows the investment details in country ‘Fortune Land’ of companies A, B, C, D, E and F. Figures in the table are in US dollars in billions.
âââââââââ
For which company is investment not increased from year 1 to year 3?
Direction: Answer the questions based on the following information.
The data given in the table shows the investment details in country ‘Fortune Land’ of companies A, B, C, D, E and F. Figures in the table are in US dollars in billions.
âââââââââ
What is the percentage difference in investments of companies A, B, C and companies D, E, F in year 2?
Direction: Answer the questions based on the following information.
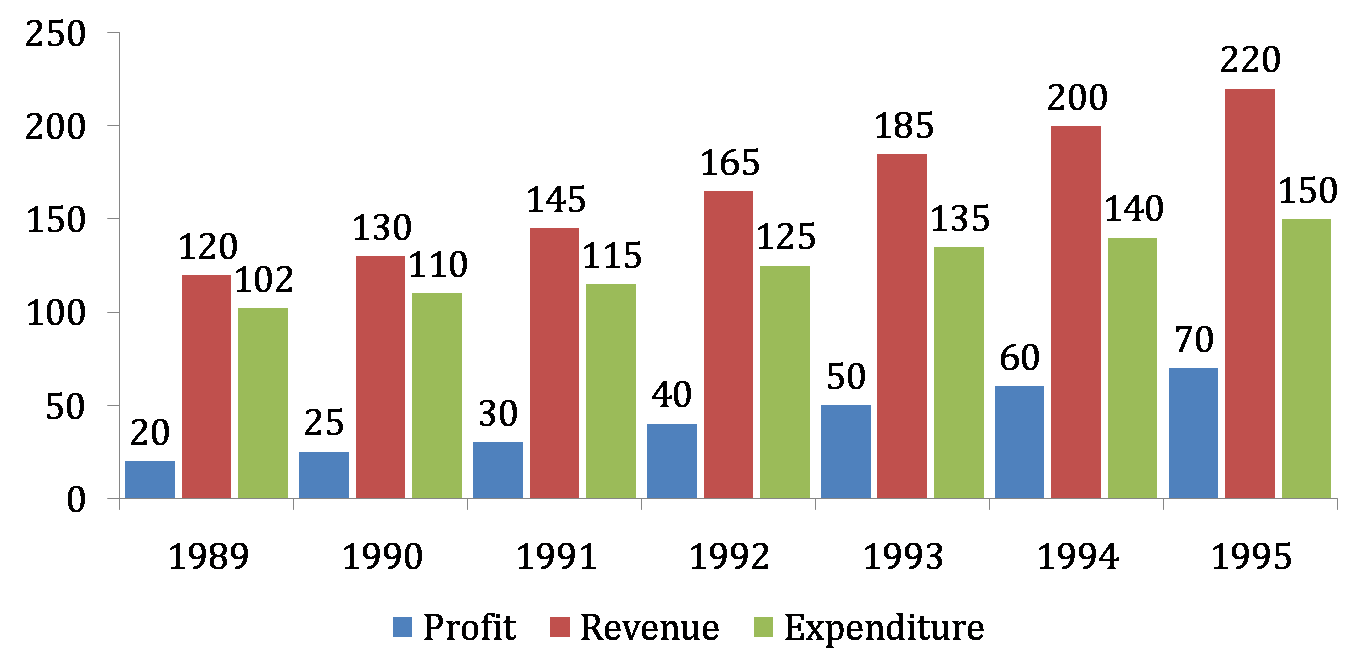
The average revenue collected in the given 7 years is approximately
Direction: Answer the questions based on the following information.
The expenditure for the 7 years together form what per cent of the revenues during the same period?
Direction: Answer the questions based on the following information.
Which year showed the greatest percentage increase in profit as compared to the previous year?
Direction: Answer the questions based on the following information.
In which year was the growth in expenditure maximum as compared to the previous year?
Direction: Answer the questions based on the following information.
If the profit in 1996 shows the annual rate of growth as it had shown in 1995 over the previous year, then what approximately will be the profit in 1996?
Direction: Answer the questions based on the following information, which gives data about certain coffee producers in India.
âââââââ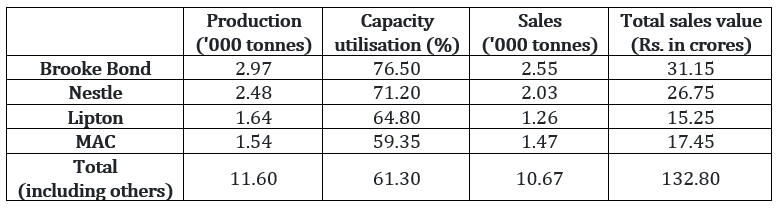 âââââââ
What is the maximum production capacity (in '000 tonnes) of Lipton for coffee?
Direction: Answer the questions based on the following information, which gives data about certain coffee producers in India.
ââââââââââââââ
Which company out of the four companies mentioned above has the maximum unutilised capacity (in '000 tonnes)?
Direction: Answer the questions based on the following information, which gives data about certain coffee producers in India.
ââââââââââââââ
What is the approximate total production capacity (in ‘000 tonnes) for coffee in India?
Direction: Answer the questions based on the following information, which gives data about certain coffee producers in India.
ââââââââââââââ
The highest price for coffee per kilogram is for
Direction: Answer the questions based on the following information, which gives data about certain coffee producers in India.
ââââââââââââââ
What percent of the total market share (by sales value) is controlled by ‘others’?
Direction: Answer the questions based on the following information.
Mulayam Software Co., before selling a package to its clients, follows the given schedule.
âââââââ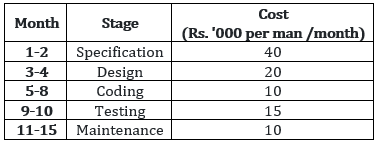
âââââââThe number of people employed in each month is:
âââââââ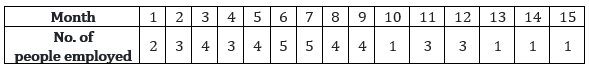 âââââââ
Due to overrun in ‘design’, the design stage took 3 months, i.e. months 3, 4 and 5. The number of people working on design in the fifth month was 5. Calculate the percentage change in the cost incurred in the fifth month. (Due to improvement in ‘coding’ technique, this stage was completed in months 6-8 only.)
Direction: Answer the questions based on the following information.
Mulayam Software Co., before selling a package to its clients, follows the given schedule.
âââââââ
âââââââThe number of people employed in each month is:
ââââââââââââââ
With reference to the above question, what is the cost incurred in the new ‘coding’ stage? (Under the new technique, 4 people work in the sixth month and 5 in the eighth.)
Direction: Answer the questions based on the following information.
Mulayam Software Co., before selling a package to its clients, follows the given schedule.
âââââââ
âââââââThe number of people employed in each month is:
ââââââââââââââ
What is the difference in cost between the old and the new techniques?
Direction: Answer the questions based on the following information.
Mulayam Software Co., before selling a package to its clients, follows the given schedule.
âââââââ
âââââââThe number of people employed in each month is:
ââââââââââââââ
Under the new technique, which stage of software development is most expensive for Mulayam Software Co.?
Direction: Answer the questions based on the following information.
Mulayam Software Co., before selling a package to its clients, follows the given schedule.
âââââââ
âââââââThe number of people employed in each month is:
ââââââââââââââ
Which five consecutive months have the lowest average cost per man-month under the new technique?
Direction: Answer the questions based on the following information.
The amount of money invested (rupees in crores) in the core infrastructure areas of two districts, Chittoor and Khammam of Andhra Pradesh, is as follows.
âââââââ âââââââ
By what per cent was the total investment in the two districts more in 1996 as compared to 1995?
Direction: Answer the questions based on the following information.
The amount of money invested (rupees in crores) in the core infrastructure areas of two districts, Chittoor and Khammam of Andhra Pradesh, is as follows.
ââââââââââââââ
The investment in electricity and thermal energy in 1995 in these two districts formed what per cent of the total investment made in that year?
Direction: Answer the questions based on the following information.
The amount of money invested (rupees in crores) in the core infrastructure areas of two districts, Chittoor and Khammam of Andhra Pradesh, is as follows.
ââââââââââââââ
In Khammam district, the investment in which area in 1996 showed the highest percentage increase over the investment in that area in 1995?
Direction: Answer the questions based on the following information.
The amount of money invested (rupees in crores) in the core infrastructure areas of two districts, Chittoor and Khammam of Andhra Pradesh, is as follows.
ââââââââââââââ
Approximately how many times was the total investment in Chittoor to the total investment in Khammam?
Direction: Answer the questions based on the following information.
The amount of money invested (rupees in crores) in the core infrastructure areas of two districts, Chittoor and Khammam of Andhra Pradesh, is as follows.
ââââââââââââââ
If the total investment in Khammam shows the same rate of increase in 1997, as it had shown from 1995 to 1996, what approximately would be the total investment in Khammam in 1997?
Direction: Answer the questions based on the following graph.

Employees in thousands Sales – Cost = Profit
Which month records the highest profit?
Direction: Answer the questions based on the following graph.
Employees in thousands Sales – Cost = Profit
In which month is the total increase in the cost highest as compared to two months ago?
Direction: Answer the questions based on the following graph.
Employees in thousands Sales – Cost = Profit
In which month is the percentage increase in sales two months before, the highest?
Direction: Answer the questions based on the following graph.
Employees in thousands Sales – Cost = Profit
Which month has the highest profit per employee?
Direction: Answer the questions based on the following graph.
Employees in thousands Sales – Cost = Profit
Assuming that no employees left the job, how many more people did the company take on in the given period?
Direction: Answer the questions based on the following information.
The first table gives the percentage of students in MBA class, who sought employment in the areas of finance, marketing and software. The second table gives the average starting salaries of the students per month, (rupees in thousands) in these areas. The third table gives the number of students who passed out in each year.
First table
âââââââ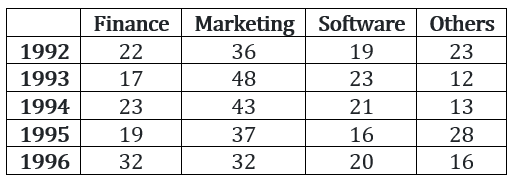
âââââââSecond table
âââââââ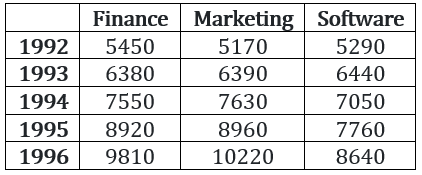
âââââââThird table

The number of students who get jobs in finance is less than the students getting marketing jobs, in the 5 years, by
Direction: Answer the questions based on the following information.
The first table gives the percentage of students in MBA class, who sought employment in the areas of finance, marketing and software. The second table gives the average starting salaries of the students per month, (rupees in thousands) in these areas. The third table gives the number of students who passed out in each year.
First table
âââââââ
âââââââSecond table
âââââââ
âââââââThird table
What is the percentage increase in the average salary of finance from 1992 to 1996?
Direction: Answer the questions based on the following information.
The first table gives the percentage of students in MBA class, who sought employment in the areas of finance, marketing and software. The second table gives the average starting salaries of the students per month, (rupees in thousands) in these areas. The third table gives the number of students who passed out in each year.
First table
âââââââ
âââââââSecond table
âââââââ
âââââââThird table
The average annual rate at which the initial salary offered in software increases is
Direction: Answer the questions based on the following information.
The first table gives the percentage of students in MBA class, who sought employment in the areas of finance, marketing and software. The second table gives the average starting salaries of the students per month, (rupees in thousands) in these areas. The third table gives the number of students who passed out in each year.
First table
âââââââ
âââââââSecond table
âââââââ
âââââââThird table
What is the average monthly salary offered to a management graduate in 1993?
Direction: Answer the questions based on the following information.
The first table gives the percentage of students in MBA class, who sought employment in the areas of finance, marketing and software. The second table gives the average starting salaries of the students per month, (rupees in thousands) in these areas. The third table gives the number of students who passed out in each year.
First table
âââââââ
âââââââSecond table
âââââââ
âââââââThird table
In 1994, students seeking jobs in finance earned ___ more than those opting for software (per annum).
Direction: Answer the questions based on the following information.
âââââââ âââââââ
âââââââGhosh Babu surveyed his companies and obtained the following data. Income tax is paid from profit before tax and the remaining amount is apportioned to dividend and retained earnings. The retained earnings were accumulated into reserves. The reserves at the beginning of 1991 were Rs.80 lakh.
In which year was the tax per rupee of ‘profit before tax’ lowest?
Direction: Answer the questions based on the following information.
ââââââââââââââ
âââââââGhosh Babu surveyed his companies and obtained the following data. Income tax is paid from profit before tax and the remaining amount is apportioned to dividend and retained earnings. The retained earnings were accumulated into reserves. The reserves at the beginning of 1991 were Rs.80 lakh.
In which year was the sales per rupee of share capital highest?
Direction: Answer the questions based on the following information.
ââââââââââââââ
âââââââGhosh Babu surveyed his companies and obtained the following data. Income tax is paid from profit before tax and the remaining amount is apportioned to dividend and retained earnings. The retained earnings were accumulated into reserves. The reserves at the beginning of 1991 were Rs.80 lakh.
In which year was the profit before tax per rupee of sales highest?
Direction: Answer the questions based on the following information.
ââââââââââââââ
âââââââGhosh Babu surveyed his companies and obtained the following data. Income tax is paid from profit before tax and the remaining amount is apportioned to dividend and retained earnings. The retained earnings were accumulated into reserves. The reserves at the beginning of 1991 were Rs.80 lakh.
In which year was the percentage addition to reserves over previous years reserves the highest?
Direction: Answer the questions based on the following information.
ââââââââââââââ
âââââââGhosh Babu surveyed his companies and obtained the following data. Income tax is paid from profit before tax and the remaining amount is apportioned to dividend and retained earnings. The retained earnings were accumulated into reserves. The reserves at the beginning of 1991 were Rs.80 lakh.
Amount of the reserves at the end of 1994 is
Direction: Answer the questions based on the following table.
âââââââ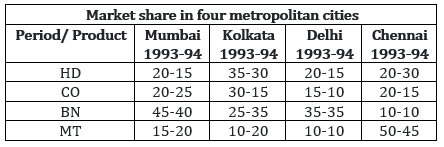 âââââââ
The maximum percentage decrease in market share is
Direction: Answer the questions based on the following table.
ââââââââââââââ
The city in which minimum number of products increased their market shares in 1993-94 is
Direction: Answer the questions based on the following table.
ââââââââââââââ
The market shares of which products did not decrease between 1993-94 in any city?
Direction: Answer the questions based on the following table.
ââââââââââââââ
The number of products which had 100% market share in four metropolitan cities is
Direction: Answer the questions based on the following table.
ââââââââââââââ
The number of products which doubled their market shares in one or more cities is
Direction: Answer the questions based on the following piecharts.


The operating profit in 1991-92 increased over that in 1990-91 by
Direction: Answer the questions based on the following piecharts.
The interest burden in 1991-92 was higher than that in 1990-91 by
Direction: Answer the questions based on the following piecharts.
If on an average, 20% rate of interest was charged on borrowed funds, then the total borrowed funds used by this company in the given two years amounted to
Direction: Answer the questions based on the following piecharts.
The retained profit in 1991-92, as compared to that in 1990-91 was
Direction: Answer the questions based on the following piecharts.
The equity base of these companies remained unchanged. Then the total dividend earning by the share holders in 1991-92 is
Direction: Answer the questions based on the following graph.

In which year was the trade deficit highest?
Direction: Answer the questions based on the following graph.
In how many years was the trade deficit less than the trade deficit in the succeeding year?
Direction: Answer the questions based on the following graph.
Export earning in 1990-91 is how many per cent of imports in 1991-92?
Direction: Answer the questions based on the following graph.
In the last three years, the total export earnings have accounted for how many per cent of the value of the imports?
Direction: Answer the questions based on the following graph.
Which of the following statements can be inferred from the graph?
I. In all the years shown in the graph, the trade deficit is less than the export earning.
II. Export earnings increased in every year between 1989-90 and 1991-92.
III. In all the years shown in the graph, the earning by exports is less than the expenditure on imports in the preceding year.
Direction: Answer the questions based on the following graph.
Revenue obtained by a publishing house while selling books, magazines and journals (Rs.in lakh).

Which year shows the highest change in revenue obtained from journals?
Direction: Answer the questions based on the following graph.
Revenue obtained by a publishing house while selling books, magazines and journals (Rs.in lakh).
In 1992, what per cent of the total revenue came from books?
Direction: Answer the questions based on the following graph.
Revenue obtained by a publishing house while selling books, magazines and journals (Rs.in lakh).
The number of years in which there was an increase in revenue from at least two categories is
Direction: Answer the questions based on the following graph.
Revenue obtained by a publishing house while selling books, magazines and journals (Rs.in lakh).
If 1993 were to show the same growth as 1992 over 1991, the revenue in 1993 must be
Direction: Answer the questions based on the following graph.
Revenue obtained by a publishing house while selling books, magazines and journals (Rs.in lakh).
The growth in total revenue from 1989 to 1992 is
Direction: Answer the questions based on the following table.
Machine M1 as well as machine M2 can independently produce either product P or product Q. The time taken by machines M1 and M2 (in minutes) to produce one unit of product P and product Q are given in the table below: (Each machine works 8 hour per day).
âââââââ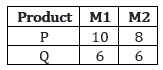 âââââââ
What is the maximum number of units that can be manufactured in one day?
Direction: Answer the questions based on the following table.
Machine M1 as well as machine M2 can independently produce either product P or product Q. The time taken by machines M1 and M2 (in minutes) to produce one unit of product P and product Q are given in the table below: (Each machine works 8 hour per day).
ââââââââââââââ
If M1 works at half its normal efficiency, what is the maximum number of units produced, if at least one unit of each must be produced?
Direction: Answer the questions based on the following table.
Machine M1 as well as machine M2 can independently produce either product P or product Q. The time taken by machines M1 and M2 (in minutes) to produce one unit of product P and product Q are given in the table below: (Each machine works 8 hour per day).
ââââââââââââââ
What is the least number of machine hours required to produce 30 pieces of P and 25 pieces of Q respectively?
Direction: Answer the questions based on the following table.
Machine M1 as well as machine M2 can independently produce either product P or product Q. The time taken by machines M1 and M2 (in minutes) to produce one unit of product P and product Q are given in the table below: (Each machine works 8 hour per day).
ââââââââââââââ
If the number of units of P is to be three times that of Q, what is the maximum idle time to maximize total units manufactured?
Direction: Answer the questions based on the following table.
Machine M1 as well as machine M2 can independently produce either product P or product Q. The time taken by machines M1 and M2 (in minutes) to produce one unit of product P and product Q are given in the table below: (Each machine works 8 hour per day).
ââââââââââââââ
If equal quantities of both are to be produced, then out of the four choices given below, the least efficient way would be
Direction: Answer the questions based on the following information.
A company produces five types of shirts — A, B, C, D and E — using cloth of three qualities — high, medium and low -, using dyes of three qualities — high, medium and low. One shirt requires 1.5 m of cloth. The following table gives respectively:
1. The number of shirts (of each category) produced, in thousands
2. The percentage distribution of cloth quality in each type of shirt, and
3. The percentage distribution of dye quality in each type of shirt.
âââââââ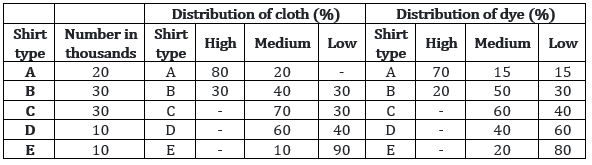 âââââââ
What is the total requirement of cloth?
Direction: Answer the questions based on the following information.
A company produces five types of shirts — A, B, C, D and E — using cloth of three qualities — high, medium and low -, using dyes of three qualities — high, medium and low. One shirt requires 1.5 m of cloth. The following table gives respectively:
1. The number of shirts (of each category) produced, in thousands
2. The percentage distribution of cloth quality in each type of shirt, and
3. The percentage distribution of dye quality in each type of shirt.
ââââââââââââââ
How many metres of low-quality cloth is consumed?
Direction: Answer the questions based on the following information.
A company produces five types of shirts — A, B, C, D and E — using cloth of three qualities — high, medium and low -, using dyes of three qualities — high, medium and low. One shirt requires 1.5 m of cloth. The following table gives respectively:
1. The number of shirts (of each category) produced, in thousands
2. The percentage distribution of cloth quality in each type of shirt, and
3. The percentage distribution of dye quality in each type of shirt.
ââââââââââââââ
How many metres of high quality cloth is consumed by A-type shirts?
Direction: Answer the questions based on the following information.
A company produces five types of shirts — A, B, C, D and E — using cloth of three qualities — high, medium and low -, using dyes of three qualities — high, medium and low. One shirt requires 1.5 m of cloth. The following table gives respectively:
1. The number of shirts (of each category) produced, in thousands
2. The percentage distribution of cloth quality in each type of shirt, and
3. The percentage distribution of dye quality in each type of shirt.
ââââââââââââââ
What is the ratio of the three qualities of dyes in high-quality cloth?
Direction: Answer the questions based on the following information.
A company produces five types of shirts — A, B, C, D and E — using cloth of three qualities — high, medium and low -, using dyes of three qualities — high, medium and low. One shirt requires 1.5 m of cloth. The following table gives respectively:
1. The number of shirts (of each category) produced, in thousands
2. The percentage distribution of cloth quality in each type of shirt, and
3. The percentage distribution of dye quality in each type of shirt.
ââââââââââââââ
What is the ratio of low-quality dye used for C-type shirts to that used for D- type shirts?
Study the graph below and answer the questions that follow.
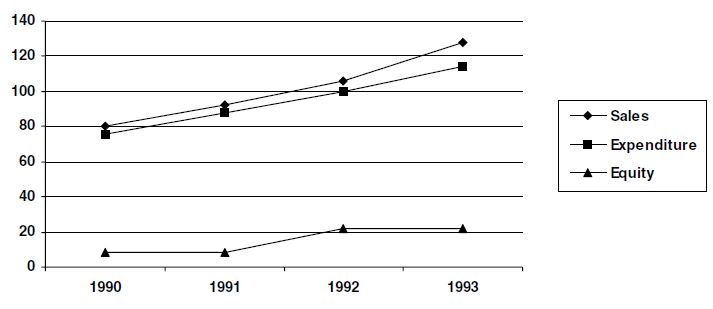
Profit is defined as Sales - Expenditure
In which year is the profit per rupee of equity the highest?
Study the graph below and answer the questions that follow.
Profit is defined as Sales - Expenditure
The simple annual growth rate in sales was the highest between the years?
Study the graph below and answer the questions that follow.
Profit is defined as Sales - Expenditure
In which year is the sales per rupee of expenditure the lowest?
Study the graph below and answer the questions that follow.
Profit is defined as Sales - Expenditure
In which year is sales per rupee of equity the highest?
Ghosh Babu has recently acquired four companies namely Arc – Net Technologies (ANT), Babu Anta Transport (BAT), Charles Anter Tailor (CAT) and Daud Akbar Transistors (DAT). When the results of the companies for the year 1992 – 93 were placed before him. He found a few interesting things about them. While the profits of CAT and DAT were the same, the sales of CAT were the same as those of BAT . Profits of ANT were 10% of its sales, where as the profits of BAT were 20% of its sales. While the total expenses of CAT were 5 times its profits, sales of DAT were 3 times its profits. The total expenses of CAT were Rs.10,00,000, the total expenses of ANT were 10% less than those of CAT. Profits are defined as the difference between sales and total expenses.
Which company had the lowest sales?
Ghosh Babu has recently acquired four companies namely Arc – Net Technologies (ANT), Babu Anta Transport (BAT), Charles Anter Tailor (CAT) and Daud Akbar Transistors (DAT). When the results of the companies for the year 1992 – 93 were placed before him. He found a few interesting things about them. While the profits of CAT and DAT were the same, the sales of CAT were the same as those of BAT . Profits of ANT were 10% of its sales, where as the profits of BAT were 20% of its sales. While the total expenses of CAT were 5 times its profits, sales of DAT were 3 times its profits. The total expenses of CAT were Rs.10,00,000, the total expenses of ANT were 10% less than those of CAT. Profits are defined as the difference between sales and total expenses.
Which company had the highest total expenses?
Ghosh Babu has recently acquired four companies namely Arc – Net Technologies (ANT), Babu Anta Transport (BAT), Charles Anter Tailor (CAT) and Daud Akbar Transistors (DAT). When the results of the companies for the year 1992 – 93 were placed before him. He found a few interesting things about them. While the profits of CAT and DAT were the same, the sales of CAT were the same as those of BAT . Profits of ANT were 10% of its sales, where as the profits of BAT were 20% of its sales. While the total expenses of CAT were 5 times its profits, sales of DAT were 3 times its profits. The total expenses of CAT were Rs.10,00,000, the total expenses of ANT were 10% less than those of CAT. Profits are defined as the difference between sales and total expenses.
Which company had the lowest profits?
Ghosh Babu has recently acquired four companies namely Arc – Net Technologies (ANT), Babu Anta Transport (BAT), Charles Anter Tailor (CAT) and Daud Akbar Transistors (DAT). When the results of the companies for the year 1992 – 93 were placed before him. He found a few interesting things about them. While the profits of CAT and DAT were the same, the sales of CAT were the same as those of BAT . Profits of ANT were 10% of its sales, where as the profits of BAT were 20% of its sales. While the total expenses of CAT were 5 times its profits, sales of DAT were 3 times its profits. The total expenses of CAT were Rs.10,00,000, the total expenses of ANT were 10% less than those of CAT. Profits are defined as the difference between sales and total expenses.
Which company had the highest profits.
Study the graph below and answer the questions.
Total Assets are defined as Net Fixed Assets + Net Current Assets + Investments
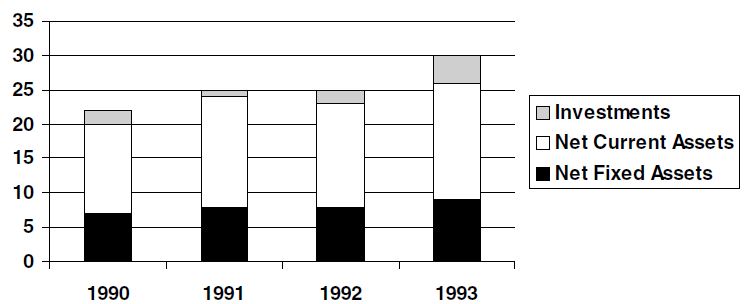
What is the approximate simple annual growth rate of Total Assets 1990 and 1993?
Study the graph below and answer the questions.
Total Assets are defined as Net Fixed Assets + Net Current Assets + Investments
In any two consecutive years, the growth rate is lowest for
Study the graph below and answer the questions.
Total Assets are defined as Net Fixed Assets + Net Current Assets + Investments
Between 1991 and 1992, the highest growth rate was seen for
Study the graph below and answer the questions.
Total Assets are defined as Net Fixed Assets + Net Current Assets + Investments
The only item which has not shown a negative growth in every year between 1990 and 1993 is
Use the following information:
A professor keeps data on students tabulated by performance and sex of the student . The data is kept on
a computer disk, but unfortunately some of it is lost because of a virus. Only the following could be
recovered :
âââââââ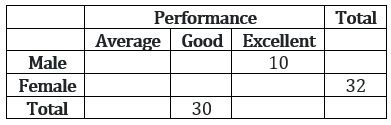 âââââââ
Panic buttons were pressed but to no avail. An expert committee was formed, which decided that the following facts were self evident:
- Half the students were either excellent or good.
- 40% of the students were females.
- One third of the male students were average.
How many students were both female and excellent?
Use the following information:
A professor keeps data on students tabulated by performance and sex of the student . The data is kept on
a computer disk, but unfortunately some of it is lost because of a virus. Only the following could be
recovered :
ââââââââââââââ
Panic buttons were pressed but to no avail. An expert committee was formed, which decided that the following facts were self evident:
- Half the students were either excellent or good.
- 40% of the students were females.
- One third of the male students were average.
How many students were both male and good?
Use the following information:
A professor keeps data on students tabulated by performance and sex of the student . The data is kept on
a computer disk, but unfortunately some of it is lost because of a virus. Only the following could be
recovered :
ââââââââââââââ
Panic buttons were pressed but to no avail. An expert committee was formed, which decided that the following facts were self evident:
- Half the students were either excellent or good.
- 40% of the students were females.
- One third of the male students were average.
Among average students, what was the ratio of male to female?
Use the following information:
A professor keeps data on students tabulated by performance and sex of the student . The data is kept on
a computer disk, but unfortunately some of it is lost because of a virus. Only the following could be
recovered :
ââââââââââââââ
Panic buttons were pressed but to no avail. An expert committee was formed, which decided that the following facts were self evident:
- Half the students were either excellent or good.
- 40% of the students were females.
- One third of the male students were average.
What proportion of female students were good?
Use the following information:
A professor keeps data on students tabulated by performance and sex of the student . The data is kept on
a computer disk, but unfortunately some of it is lost because of a virus. Only the following could be
recovered :
ââââââââââââââ
Panic buttons were pressed but to no avail. An expert committee was formed, which decided that the following facts were self evident:
- Half the students were either excellent or good.
- 40% of the students were females.
- One third of the male students were average.
What proportion of good students were male?
Given below are the forecasts of the World and Asian energy demand for the years 1990, 2000 and 2010 AD. The demand is given in million barrels per day, crude oil equivalent.âââââââ
âââââââ ââââââââââââââ
Over 1990 – 2010, which two fuels meet more than 60 percent of the total energy demand of both World and Asia?
Given below are the forecasts of the World and Asian energy demand for the years 1990, 2000 and 2010 AD. The demand is given in million barrels per day, crude oil equivalent.âââââââ
âââââââââââââââââââââ
Which fuel’s proportion in the total energy demand increases over the decade 1990–2000 and decreases over the decade 2000 – 2010 for both the World and Asia?
Given below are the forecasts of the World and Asian energy demand for the years 1990, 2000 and 2010 AD. The demand is given in million barrels per day, crude oil equivalent.âââââââ
âââââââââââââââââââââ
Which is the fuel whose proportion in the total energy demand will decrease continuously over the period 1990 – 2010, in Asia?
Given below are the forecasts of the World and Asian energy demand for the years 1990, 2000 and 2010 AD. The demand is given in million barrels per day, crude oil equivalent.âââââââ
âââââââââââââââââââââ
Which is the fuel whose proportion to the total energy demand of the world will remain constant over the period 1990 – 2010 but whose proportion will increase in the total energy demand in Asia?
The following table gives the national income and the population of a country for the years 1984 – 85 to 1989 – 90. For each o the following questions choose the best alternative:
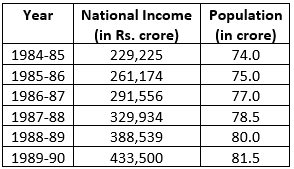 âââââââ
The increase in the per capita income compared to the previous year is lowest for the year :
The following table gives the national income and the population of a country for the years 1984 – 85 to 1989 – 90. For each o the following questions choose the best alternative:
âââââââ
The per capita income is highest for the year :
The following table gives the national income and the population of a country for the years 1984 – 85 to 1989 – 90. For each o the following questions choose the best alternative:
âââââââ
The difference between the percentage increase in per capita income and the percentage increase in the population compared to the previous year is highest for the year:
The following table gives the national income and the population of a country for the years 1984 – 85 to 1989 – 90. For each o the following questions choose the best alternative:
âââââââ
The rate of increase in population was lowest in the year:
The following table gives the national income and the population of a country for the years 1984 – 85 to 1989 – 90. For each o the following questions choose the best alternative:
âââââââ
Increase in the per capita income compared to the previous year among the years given below was highest for the year:
The graph below shows the end of the month market values of 4 shares for the period from January to June. Answer the following questions based on this graph.
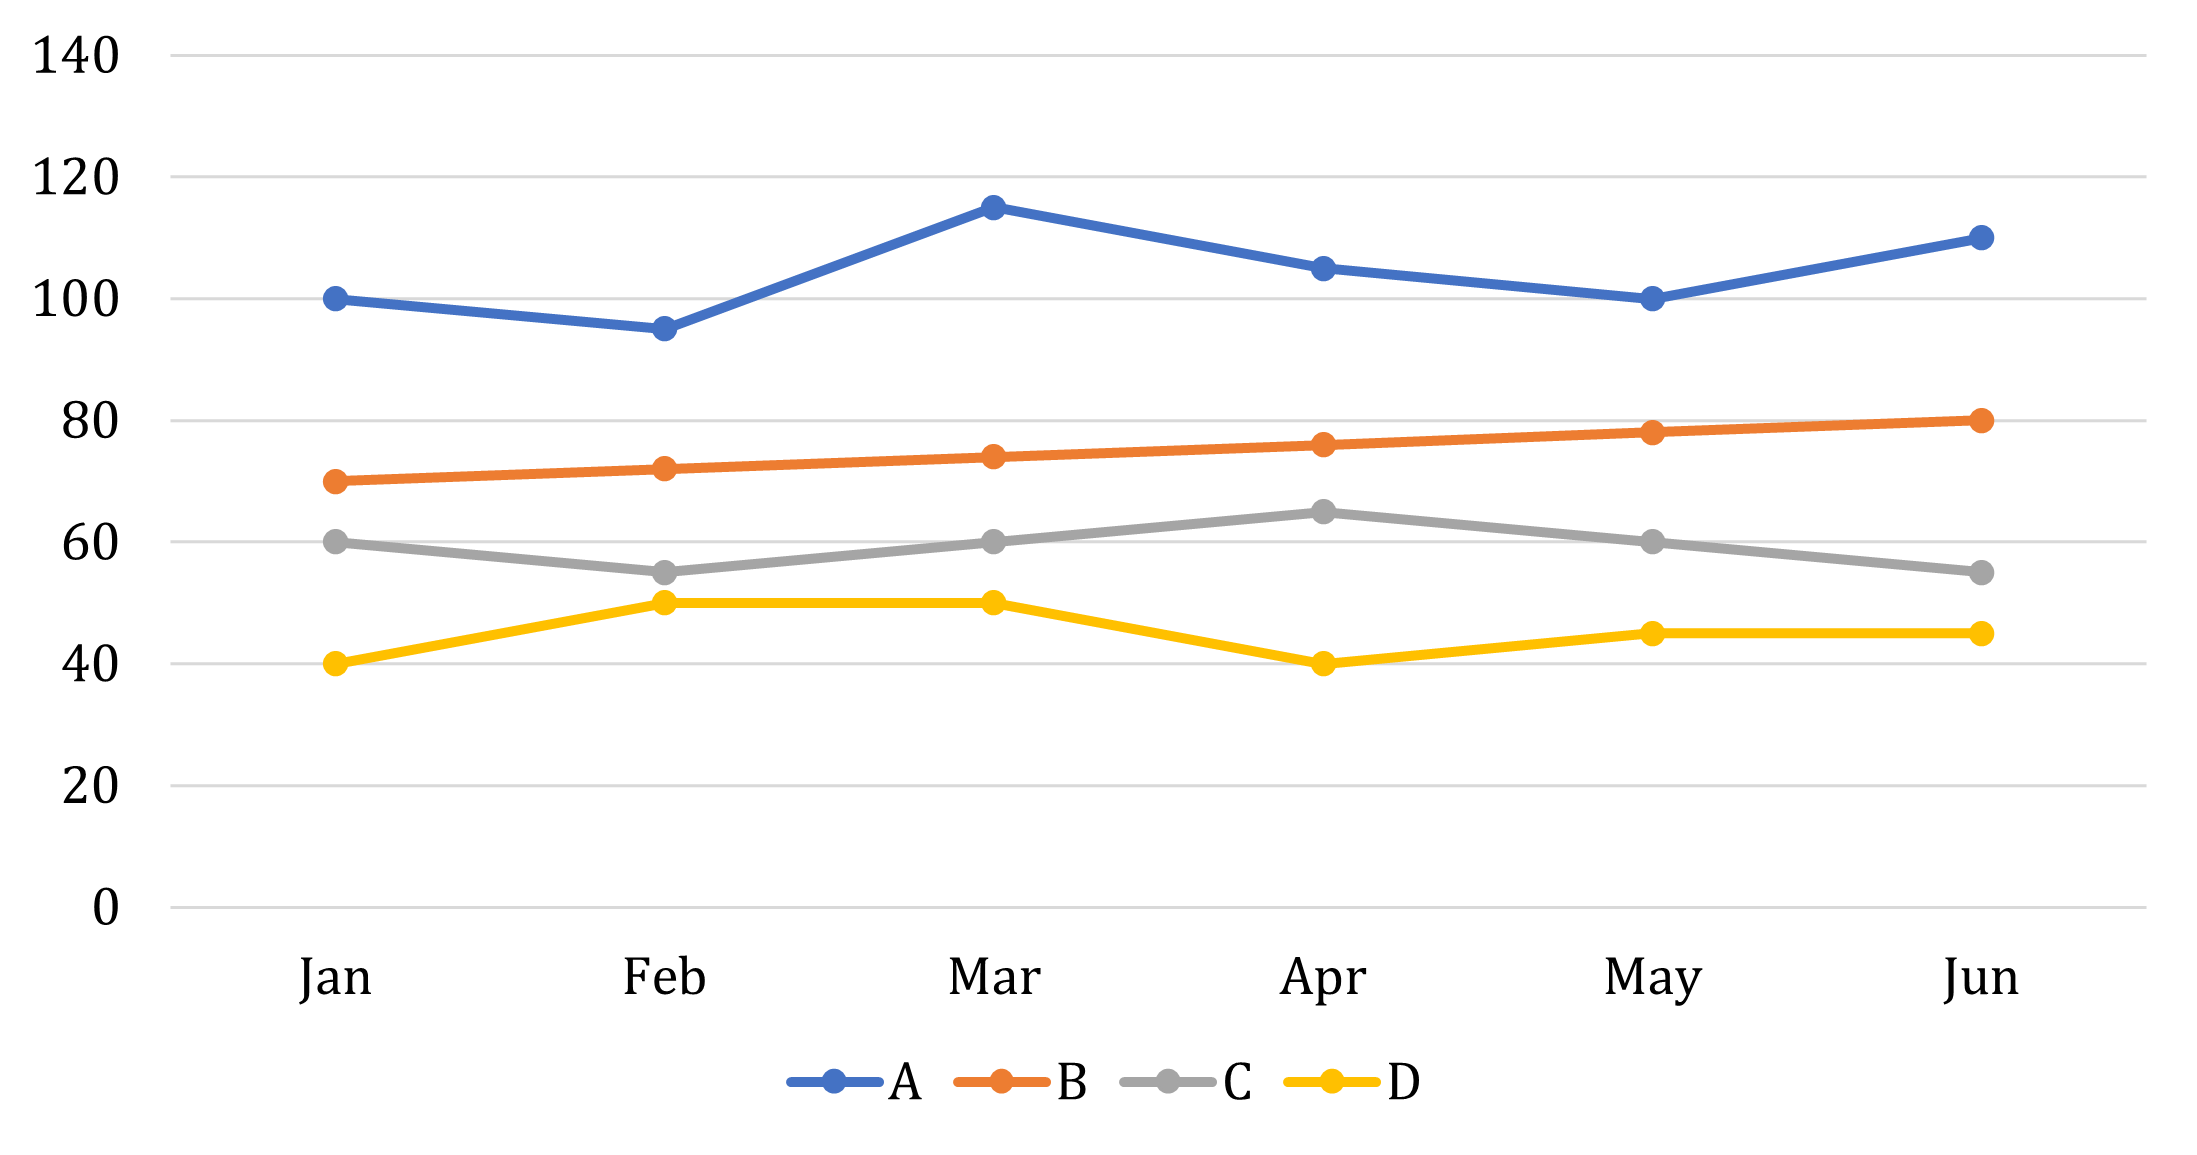
Which share showed the greatest percentage increase in market value in any month during the entire period?
The graph below shows the end of the month market values of 4 shares for the period from January to June. Answer the following questions based on this graph.
In which month was the greatest absolute change in market value for any share recorded?
The graph below shows the end of the month market values of 4 shares for the period from January to June. Answer the following questions based on this graph.
In which month was the greatest percentage increase in market value for any share recorded?
The graph below shows the end of the month market values of 4 shares for the period from January to June. Answer the following questions based on this graph.
An individual wishes to sell 1 share of C and 1 share of D to buy 1 share of A at the end of a month. At which month-end would the individual’s loss from this decision, due to share value changes, be the most?
The graph below shows the end of the month market values of 4 shares for the period from January to June. Answer the following questions based on this graph.
An individual decides to sell 1 share of C and 1 share of D to buy 1 share of A at the end of the month. What can be the individual’s greatest gain from this decision, due to share value changes?
Study the following graph and answer questions that follow. The x – axis denotes the years from 1983 to 1991.
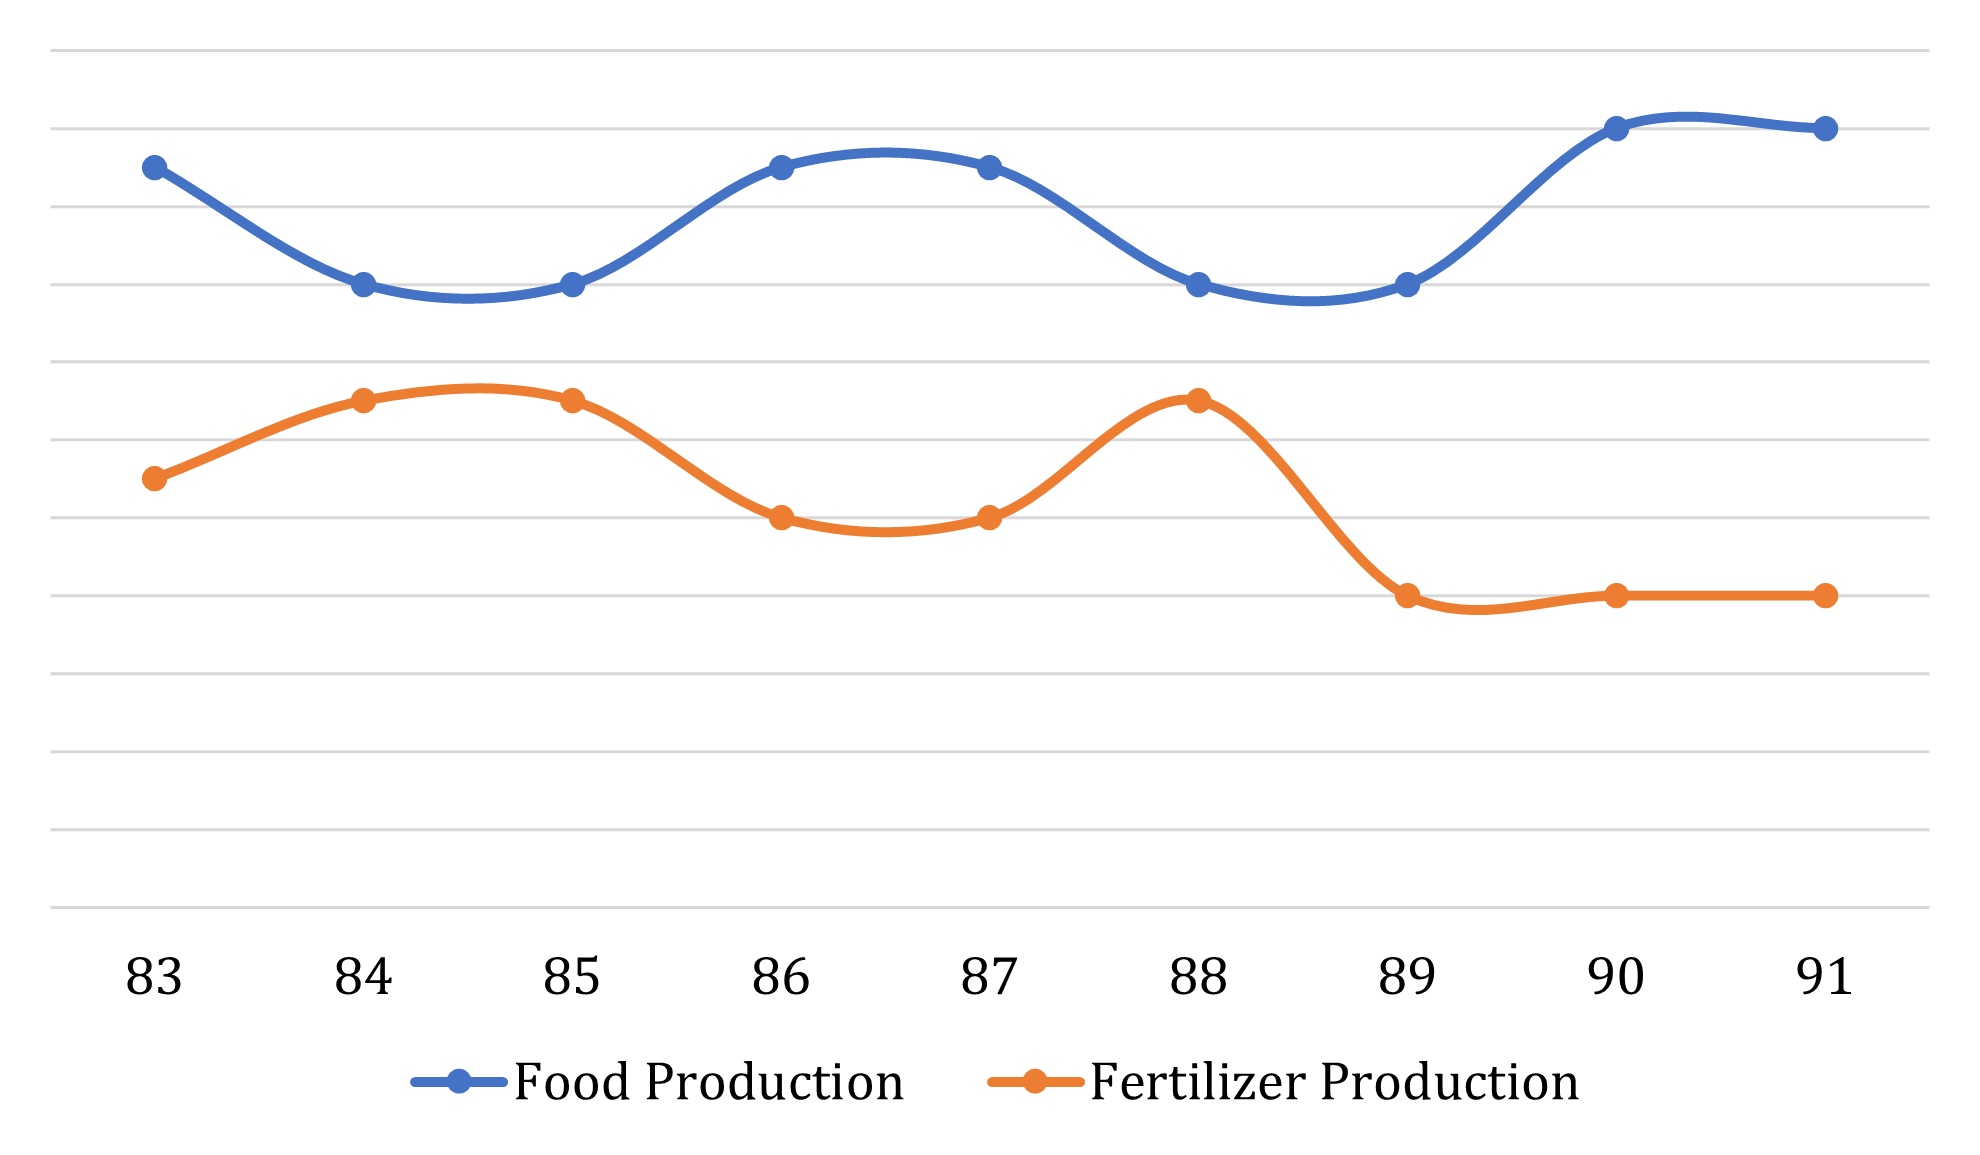
The sum of food and fertilizer production has shown a constant value for how many years?
Study the following graph and answer questions that follow. The x – axis denotes the years from 1983 to 1991.
If in 1988, the sum of the food and fertilizer production was 170 million tonnes, the value of food production must have been (approximately, in million tonnes) …
Study the following graph and answer questions that follow. The x – axis denotes the years from 1983 to 1991.
From its apparent behaviour, the food production in year 1992 can be expected to …
Study the following graph and answer questions that follow. The x – axis denotes the years from 1983 to 1991.
Going according to previous trends, one can say that the Fertilizer Production has shown an anomalous behaviour in which year?
Study the following graph and answer questions that follow. The x – axis denotes the years from 1983 to 1991.
A scholar observed that if the production of fertilizers in 1989 had been the same as that in 1988, then the total fertilizer production for all the given years would have been 450 million tonnes. Using this information, and knowing that the food production has been plotted on the same scale, one may say that the food production in 1983 was approximately, in million tonnes) …