CAT 1991 — DILR Question 28
Bar GraphsEasy
Passage / Data
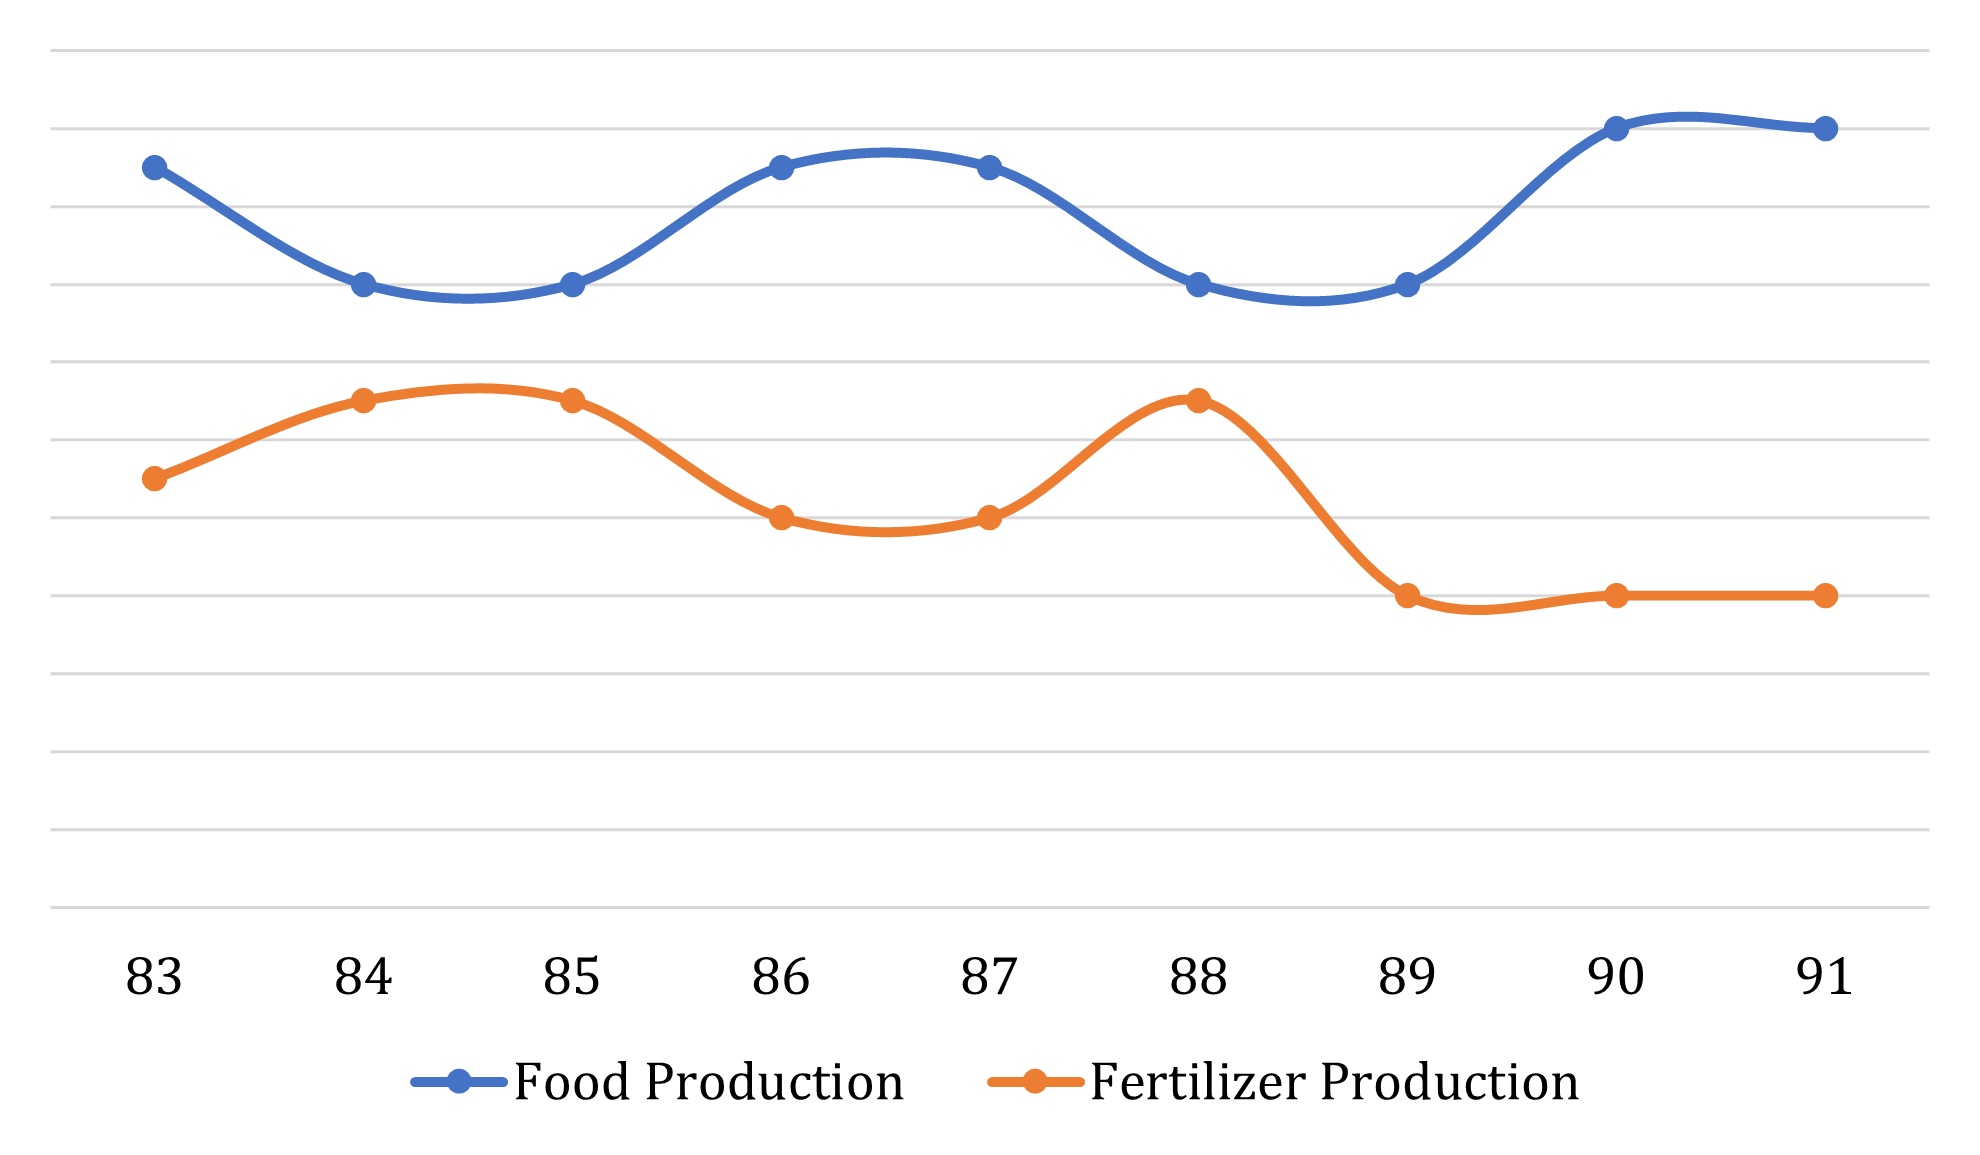
Study the following graph and answer questions that follow. The x – axis denotes the years from 1983 to 1991.
From its apparent behaviour, the food production in year 1992 can be expected to …
Answer & solution
- A
go up
go down
- C
remain the same as previous year
- D
nothing can be said
Solution
The graph of food production shows an alternate increase and decrease in every 1 to 2 years.
Hence looking at the trend of the graph in 1990 and 1991, it can be expected that the graph will go down in 1992.
Hence, option (b).