CAT 1991 — DILR Question 30
Study the following graph and answer questions that follow. The x – axis denotes the years from 1983 to 1991.
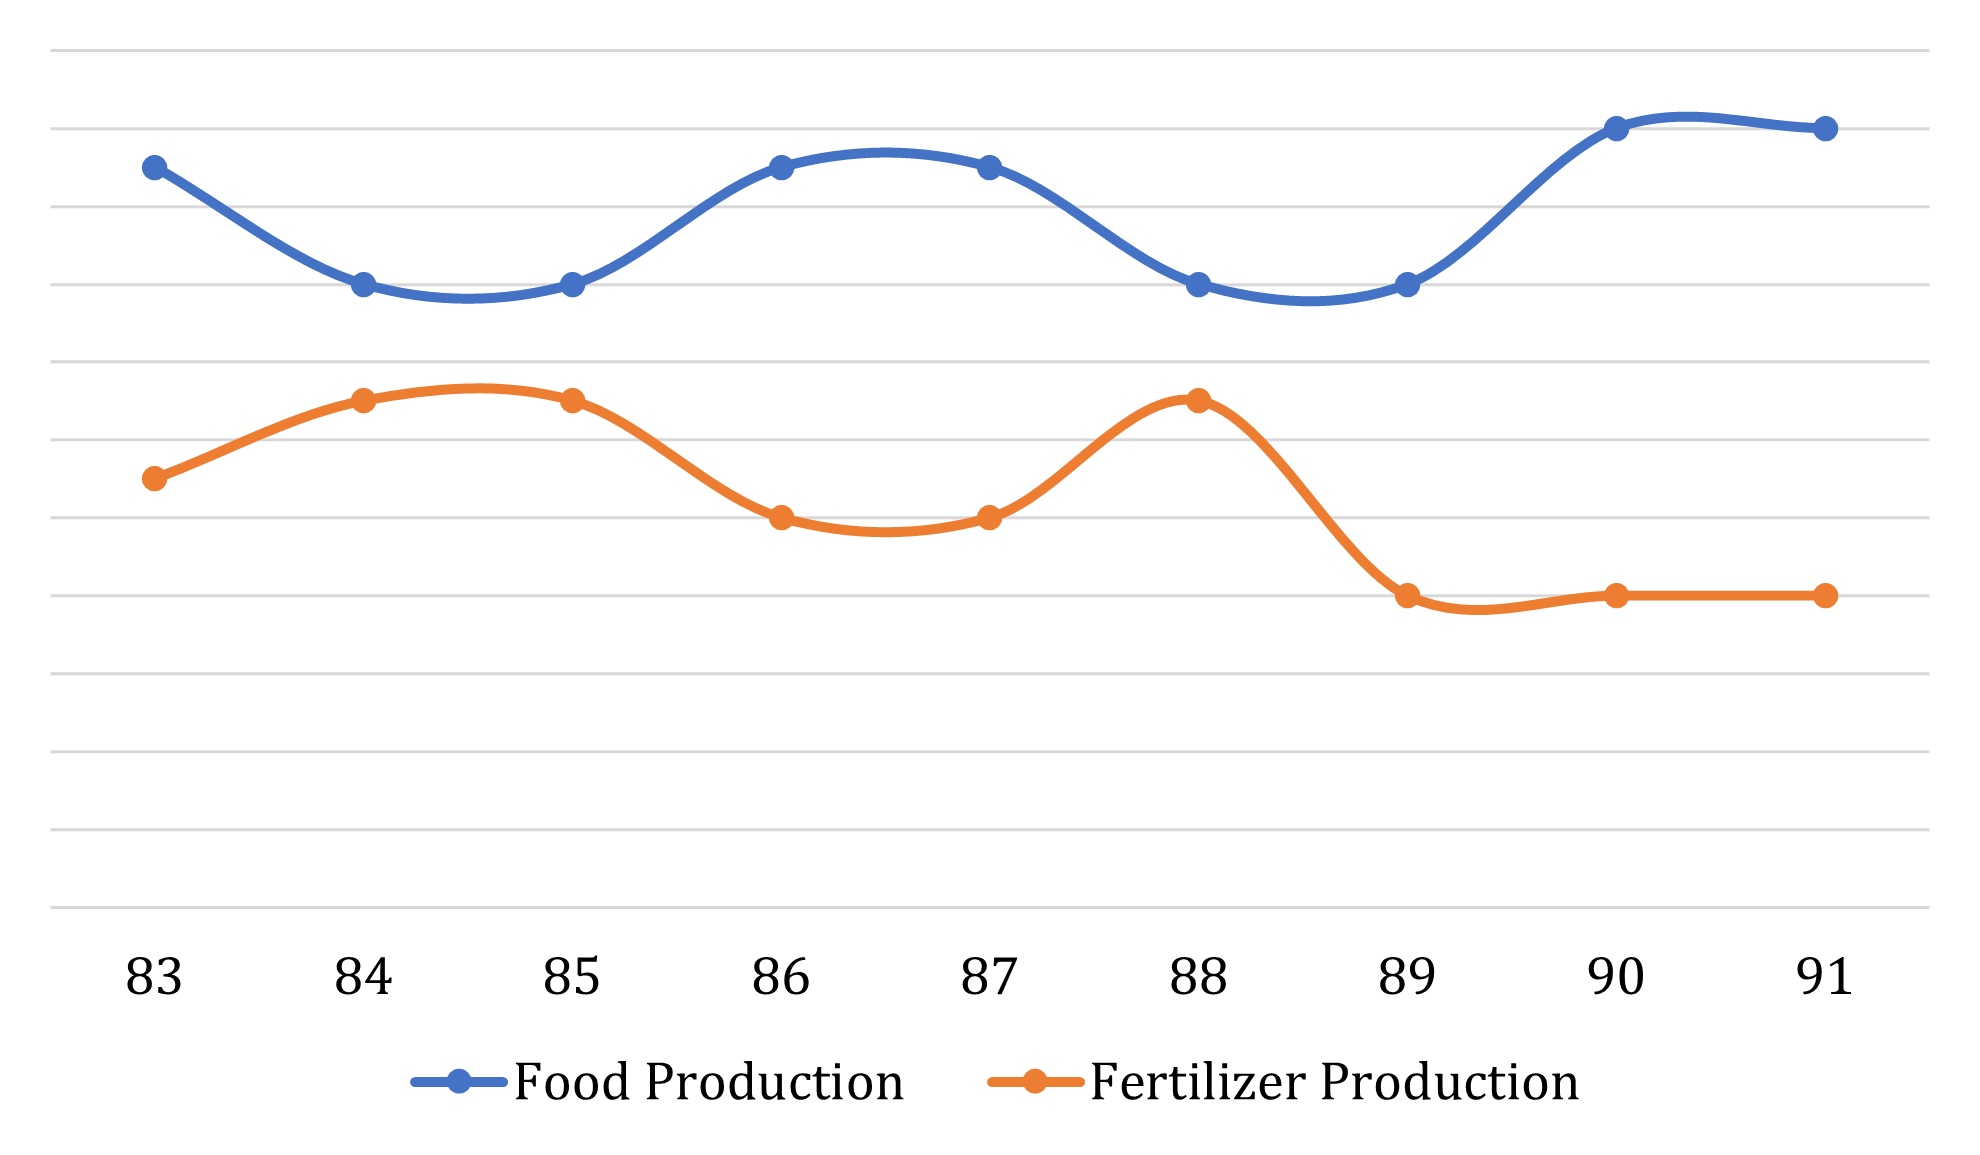
A scholar observed that if the production of fertilizers in 1989 had been the same as that in 1988, then the total fertilizer production for all the given years would have been 450 million tonnes. Using this information, and knowing that the food production has been plotted on the same scale, one may say that the food production in 1983 was approximately, in million tonnes) …
Answer & solution
- A
80
- B
130
- C
105
Cannot be determined
If the fertilizer production in 1989 had been the same as that in 1988, its value for 1989 would have been 3.5x + k.
Hence total fertilizer production according to our values would have been (5.5x + k + 6.5x + k + 6.5x + k + 5x + k + 5x + k + 6.5x + k + 6.5x + k + 4x + k + 4x + k) = 49.5x + 9k.
As per the given information 49.5x + k = 490
Value of x and k cannot be determined.
Hence, option (d).