CAT 1991 — DILR Question 29
Bar GraphsEasy
Passage / Data
Study the following graph and answer questions that follow. The x – axis denotes the years from 1983 to 1991.
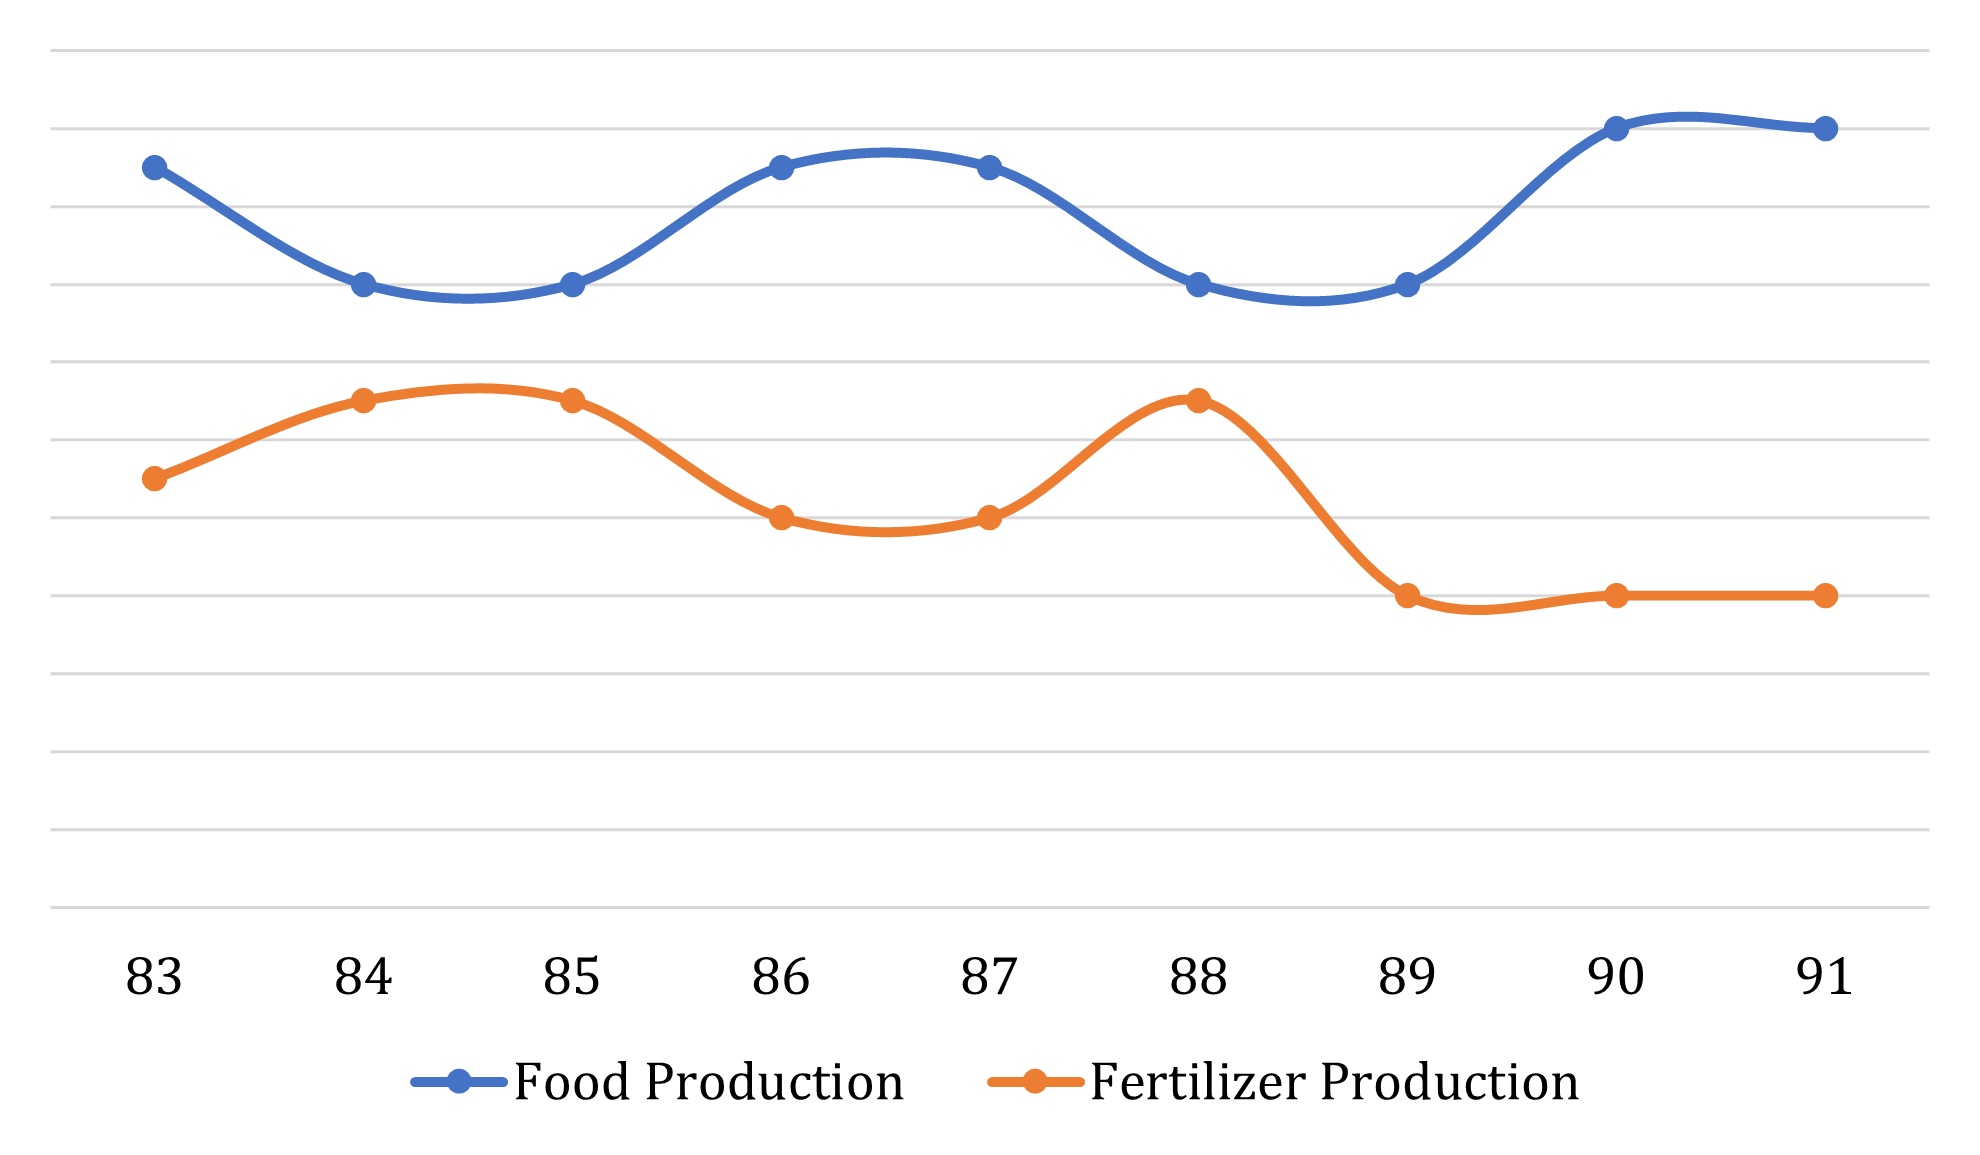
Going according to previous trends, one can say that the Fertilizer Production has shown an anomalous behaviour in which year?
Answer & solution
- A
1985
- B
1984
- C
1991
1989
Solution
It is clear that the graph for fertilizer production remains constant for two consecutive years.
But it breaks this trend in 1989 as it has a value lower than its value in 1988.
Hence, option (d).