CAT 2002 — DILR Question 2
Bar GraphsEasy
Passage / Data
Answer the following question based on the information given below.
The chart given below indicates the annual sales tax revenue collections (in crores of rupees) of seven states from 1996 to 2001.
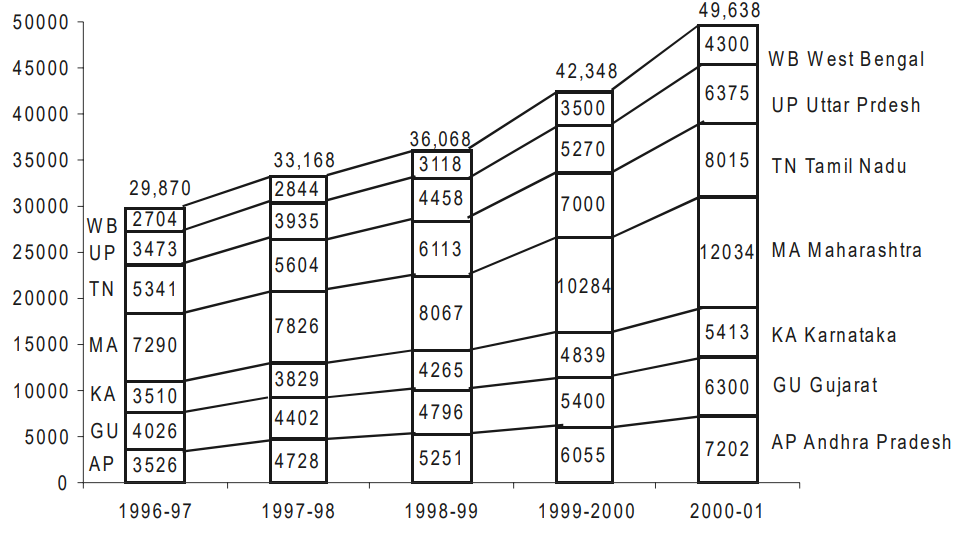
Which of the following states has changed its relative ranking most number of times when you rank the states in terms of the descending volume of sales tax collections each year?
Answer & solution
Correct answer: Uttar Pradesh
- A
Andhra Pradesh
Uttar Pradesh
- C
Karnataka
- D
Tamil Nadu
Solution
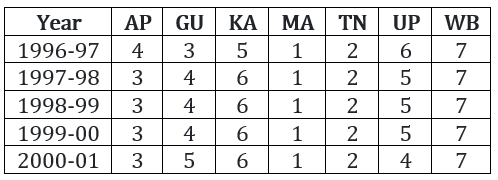
From the table, we see that UP and GU have changed their rankings twice (in the years1997-98 and 2000-01).
Hence, option (b).
Related Bar Graphs questions
- If for each year, the states are ranked in terms of descending order of sales ta…
- The percentage share of sales tax revenue of which state has increased from 1997…
- Which pair of successive years shows the maximum growth rate of tax revenue in M…
- Identify the state whose tax revenue increased exactly by the same amount in two…
- Which state below has been maintaining a constant rank over the years in terms o…