CAT 2002 — DILR
All 39 DILR questions from CAT 2002, with the answer key and detailed solutions. Practise free — check answers as you go, or tap Show solution.
CAT 2002 · DILR
Answer the following question based on the information given below.
The chart given below indicates the annual sales tax revenue collections (in crores of rupees) of seven states from 1996 to 2001.
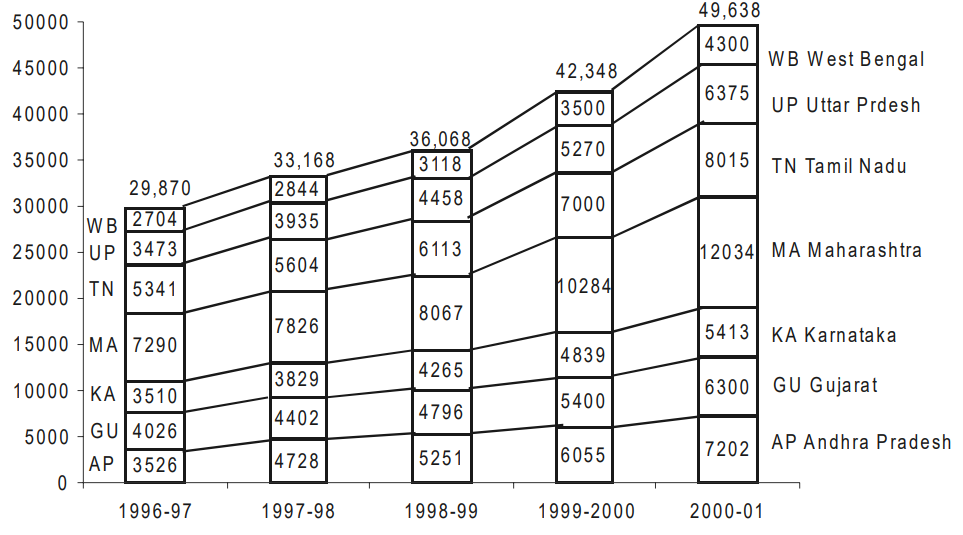
If for each year, the states are ranked in terms of descending order of sales tax collections, then how many states don't change their ranking more than once over the five years?
Answer the following question based on the information given below.
The chart given below indicates the annual sales tax revenue collections (in crores of rupees) of seven states from 1996 to 2001.
Which of the following states has changed its relative ranking most number of times when you rank the states in terms of the descending volume of sales tax collections each year?
Answer the following question based on the information given below.
The chart given below indicates the annual sales tax revenue collections (in crores of rupees) of seven states from 1996 to 2001.
The percentage share of sales tax revenue of which state has increased from 1997 to 2001?
Answer the following question based on the information given below.
The chart given below indicates the annual sales tax revenue collections (in crores of rupees) of seven states from 1996 to 2001.
Which pair of successive years shows the maximum growth rate of tax revenue in Maharashtra?
Answer the following question based on the information given below.
The chart given below indicates the annual sales tax revenue collections (in crores of rupees) of seven states from 1996 to 2001.
Identify the state whose tax revenue increased exactly by the same amount in two successive pair of years?
Answer the following question based on the information given below.
The chart given below indicates the annual sales tax revenue collections (in crores of rupees) of seven states from 1996 to 2001.
Which state below has been maintaining a constant rank over the years in terms of its contribution to the total tax collections?
Answer the following question based on the information given below.
The table below gives information about four different crops, their different quality categories and the regions where they are cultivated. Based on the information given in the table, answer the questions given below:
 ââââââââââââââ
How many regions produce medium quality of Crop-1 or Crop-2 and also produce low quality of Crop-3 or Crop-4?
Answer the following question based on the information given below.
The table below gives information about four different crops, their different quality categories and the regions where they are cultivated. Based on the information given in the table, answer the questions given below:
ââââââââââââââ
Which of the following statements is true?
Answer the following question based on the information given below.
The table below gives information about four different crops, their different quality categories and the regions where they are cultivated. Based on the information given in the table, answer the questions given below:
ââââââââââââââ
How many low quality Crop-1 producing regions are either high quality Crop-4 producing regions or medium quality Crop-3 producing regions?
Answer the following question based on the information given below.
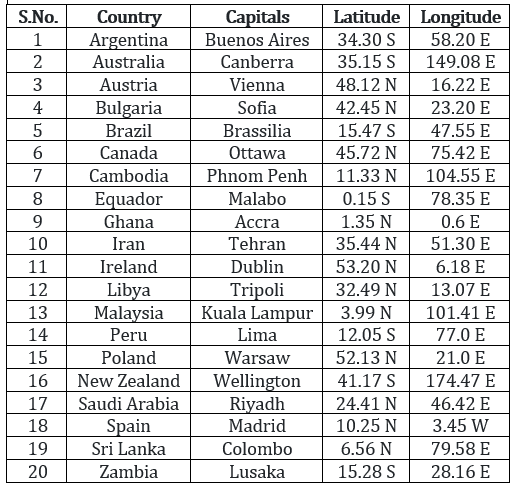
Answer these questions based on the table given below.
 ââââââââââââââ
What percentage of cities located within 10° E and 40° E (10° east and 40° east) lie in the Southern Hemisphere?
Answer the following question based on the information given below.
Answer these questions based on the table given below.
ââââââââââââââ
The number of cities whose name begin with a consonant and are in the Northern Hemisphere in the table:
Answer the following question based on the information given below.
Answer these questions based on the table given below.
ââââââââââââââ
The ratio of the number of countries whose name starts with vowel and located in the Southern Hemisphere, to the number of countries, the name of whose capital cities starts with a vowel in the table above is:
Answer the following question based on the information given below.
The following table shows the earnings of employees in the month of June 2002. They generally worked 25 days in a month.
 ââââââââââââââ
The number of employees who have earned more than Rs. 50 per day in complex operation is:
Answer the following question based on the information given below.
The following table shows the earnings of employees in the month of June 2002. They generally worked 25 days in a month.
ââââââââââââââ
The number of employees who have earned more than Rs. 600 and having more than 80% attendance (there are 25 regular working days in June 2002; some might be coming on overtime too) is:
Answer the following question based on the information given below.
The following table shows the earnings of employees in the month of June 2002. They generally worked 25 days in a month.
ââââââââââââââ
The employee number of the person (among the following) who has earned the maximum earnings per day in medium operations is:
Answer the following question based on the information given below.
The following table shows the earnings of employees in the month of June 2002. They generally worked 25 days in a month.
ââââââââââââââ
Among the employees who were engaged in complex and medium operations, the number of employees whose average earnings per day in complex operations is more than their average earnings per day in medium operations is:
Answer the following question based on the information given below.
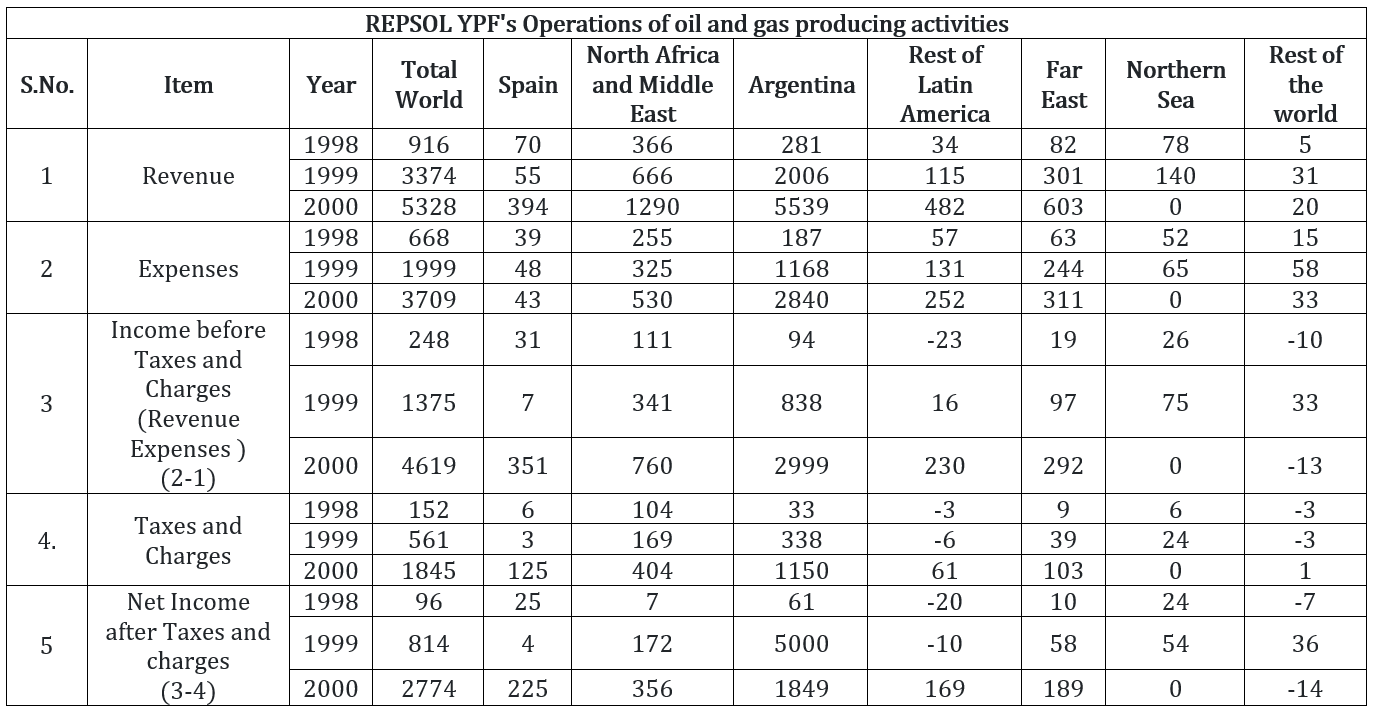
Following table shows the REPSOL YPF's Operations of oil and gas producing activities.
 ââââââââââââââ
How many operations (Spain, North Africa and Middle East, …) of the company account for less than 5% of the total revenue earned in the year 1999?
Answer the following question based on the information given below.
Following table shows the REPSOL YPF's Operations of oil and gas producing activities.
ââââââââââââââ
How many operations (Spain, North Africa and Middle East, …) of the company account for less than 5% of the total revenue earned in the year 1999 to 2000?
Answer the following question based on the information given below.
Following table shows the REPSOL YPF's Operations of oil and gas producing activities.
ââââââââââââââ
How many operations registered a sustained yearly increase in income before taxes and charges from 1998 to 2000?
Answer the following question based on the information given below.
Following table shows the REPSOL YPF's Operations of oil and gas producing activities.
ââââââââââââââ
Ignoring the loss making operations of the company in 1998, for how many operations was the percentage increase in net income before taxes and charges higher than the average increase from 1998 to 1999?
Answer the following question based on the information given below.
Following table shows the REPSOL YPF's Operations of oil and gas producing activities.
ââââââââââââââ
If profitability is defined as the ratio of net income after taxes and charges to expenses, then which of the following statements is true?
Answer the following question based on the information given below.
Following table shows the REPSOL YPF's Operations of oil and gas producing activities.
ââââââââââââââ
In the year 2000, which among the following countries had the best profitability?
Answer the following question based on the information given below.
Following table shows the REPSOL YPF's Operations of oil and gas producing activities.
ââââââââââââââ
If efficiency is defined as the ratio of revenue to expenses, then which operation was the least efficient in the year 2000?
Answer the following question based on the information given below.
Following table shows the REPSOL YPF's Operations of oil and gas producing activities.
ââââââââââââââ
Of the following statements which is not true?
Answer the following question based on the information given below.
Chart A represents the distribution by value of top 6 suppliers of MFA Textiles in 1995. The total value of Chart A is 5760 million Euro.
Chart B represents the distribution by quantity of top 6 suppliers of MFA Textiles in 1995. The total value of Chart B is 1.05 million tons.


The country which has the highest average price is:
Answer the following question based on the information given below.
Chart A represents the distribution by value of top 6 suppliers of MFA Textiles in 1995. The total value of Chart A is 5760 million Euro.
Chart B represents the distribution by quantity of top 6 suppliers of MFA Textiles in 1995. The total value of Chart B is 1.05 million tons.
The average price (Euro per kg) in Turkey is roughly:
Answer the following question based on the information given below.
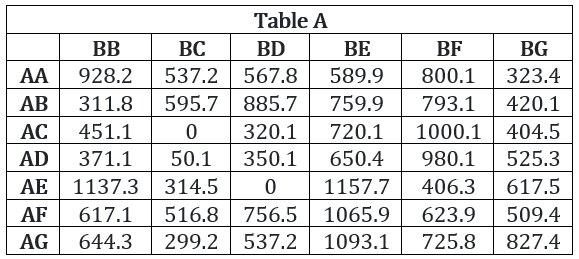
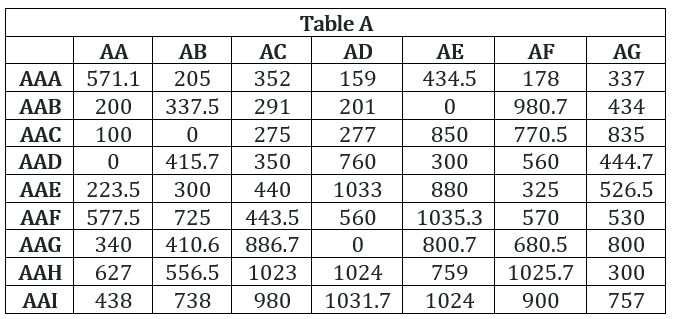
There are 6 refineries, 7 depots, 9 districts. The refineries are BB, BC, BD, BE, BF, BG. The depots are AA, AB, AC, AD, AE, AF and AG and the districts are AAA, AAB, AAC, AAD, AAE, AAF, AAG, AAH, AAI.
Table A shows the cost of transporting one unit from refinery to depot.
Table B shows the cost of transporting one unit from depot to districts.
 ââââââââââââââ
 ââââââââââââââ
The minimum cost of sending one unit from any refinery to any district is:
Answer the following question based on the information given below.
There are 6 refineries, 7 depots, 9 districts. The refineries are BB, BC, BD, BE, BF, BG. The depots are AA, AB, AC, AD, AE, AF and AG and the districts are AAA, AAB, AAC, AAD, AAE, AAF, AAG, AAH, AAI.
Table A shows the cost of transporting one unit from refinery to depot.
Table B shows the cost of transporting one unit from depot to districts.
ââââââââââââââ
ââââââââââââââ
How many possible ways are there for sending one unit from any refinery to any district?
Answer the following question based on the information given below.
There are 6 refineries, 7 depots, 9 districts. The refineries are BB, BC, BD, BE, BF, BG. The depots are AA, AB, AC, AD, AE, AF and AG and the districts are AAA, AAB, AAC, AAD, AAE, AAF, AAG, AAH, AAI.
Table A shows the cost of transporting one unit from refinery to depot.
Table B shows the cost of transporting one unit from depot to districts.
ââââââââââââââ
ââââââââââââââ
The largest cost of sending one unit from any refinery to district is:
Answer the following question based on the information given below.
There are 6 refineries, 7 depots, 9 districts. The refineries are BB, BC, BD, BE, BF, BG. The depots are AA, AB, AC, AD, AE, AF and AG and the districts are AAA, AAB, AAC, AAD, AAE, AAF, AAG, AAH, AAI.
Table A shows the cost of transporting one unit from refinery to depot.
Table B shows the cost of transporting one unit from depot to districts.
ââââââââââââââ
ââââââââââââââ
The minimum cost of transportation of one unit from refinery BD to any district is:
Answer the following question based on the information given below.
There are 6 refineries, 7 depots, 9 districts. The refineries are BB, BC, BD, BE, BF, BG. The depots are AA, AB, AC, AD, AE, AF and AG and the districts are AAA, AAB, AAC, AAD, AAE, AAF, AAG, AAH, AAI.
Table A shows the cost of transporting one unit from refinery to depot.
Table B shows the cost of transporting one unit from depot to districts.
ââââââââââââââ
ââââââââââââââ
The minimum cost of transportation from any refinery to AAG district is:
Answer the following question based on the information given below.
There are 6 refineries, 7 depots, 9 districts. The refineries are BB, BC, BD, BE, BF, BG. The depots are AA, AB, AC, AD, AE, AF and AG and the districts are AAA, AAB, AAC, AAD, AAE, AAF, AAG, AAH, AAI.
Table A shows the cost of transporting one unit from refinery to depot.
Table B shows the cost of transporting one unit from depot to districts.
ââââââââââââââ
ââââââââââââââ
The minimum cost of transportation from refinery BE to district AAA is:
Answer the following question based on the information given below.
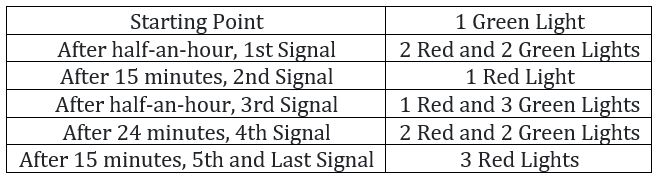
In a country, the following signals are applicable:
 ââââââââââââââ
A man headed towards north and follows the given signals as:
 ââââââââââââââ
What is the total distance covered by the man till the last signal?
Answer the following question based on the information given below.
In a country, the following signals are applicable:
ââââââââââââââ
A man headed towards north and follows the given signals as:
ââââââââââââââ
What is his net displacement with respect to the starting point?
Answer the following question based on the information given below.
In a country, the following signals are applicable:
ââââââââââââââ
A man headed towards north and follows the given signals as:
ââââââââââââââ
If the first signal after the starting point, is 1 Red and 2 Green lights, then what is the total distance covered by the man till the last signal?
Answer the following question based on the information given below.
In a country, the following signals are applicable:
ââââââââââââââ
A man headed towards north and follows the given signals as:
ââââââââââââââ
Instead of heading North, if the man was heading South, then by the end of the journey, he was
Answer the following question based on the information given below.
A causes B or C, but not both.
F occurs only if B occurs.
D occurs if B or C occurs.
E occurs only if C occurs.
J occurs only if E or F occurs.
D causes G or H or both.
H occurs if E occurs.
G occurs if F occurs.
If A occurs, which may occur?
I. F and G
II. E and H
III. D
Answer the following question based on the information given below.
A causes B or C, but not both.
F occurs only if B occurs.
D occurs if B or C occurs.
E occurs only if C occurs.
J occurs only if E or F occurs.
D causes G or H or both.
H occurs if E occurs.
G occurs if F occurs.
Which of these may occur as a result of a cause not mentioned?
Answer the following question based on the information given below.
A causes B or C, but not both.
F occurs only if B occurs.
D occurs if B or C occurs.
E occurs only if C occurs.
J occurs only if E or F occurs.
D causes G or H or both.
H occurs if E occurs.
G occurs if F occurs.
There are six persons sitting around a round table. Pankaj is sitting left of Dayanand who is facing Kundan. Ranjan is sitting right of Dayanand. Yash is sitting left of Pankaj and Abhishek is sitting right of Ranjan. If Pankaj and Ranjan swap their positions and Yash and Abhishek also swap their positions, then who will be to left of Abhishek?