CAT 2002 — DILR Question 4
Bar GraphsEasy
Passage / Data
Answer the following question based on the information given below.
The chart given below indicates the annual sales tax revenue collections (in crores of rupees) of seven states from 1996 to 2001.
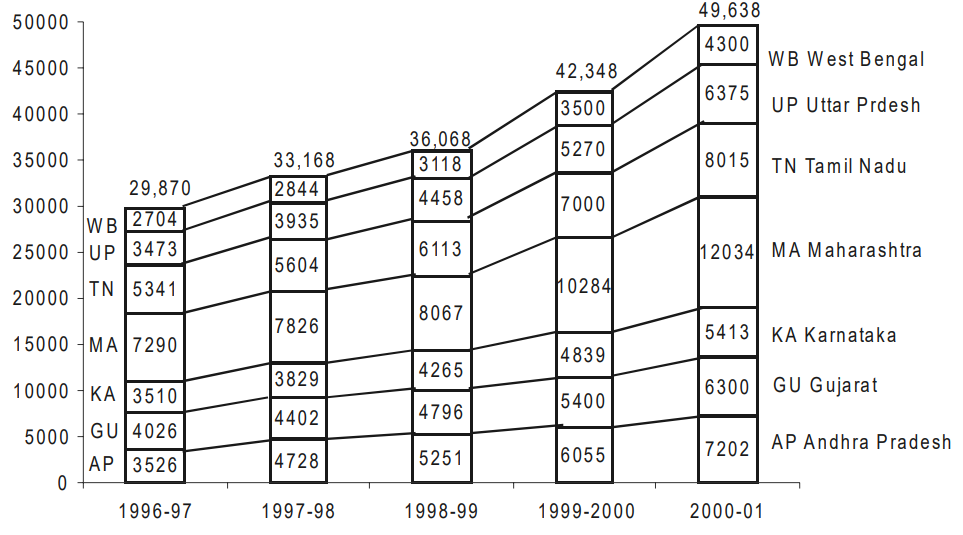
Which pair of successive years shows the maximum growth rate of tax revenue in Maharashtra?
Answer & solution
- A
1997 to 1998
- B
1998 to 1999
1999 to 2000
- D
2000 to 2001
Solution
Growth rate of tax revenue in MA for 1997-98
× 100
Growth rate of tax revenue in MA for 1998-99
× 100
Growth rate of tax revenue in MA for 1999-00
× 100
Growth rate of tax revenue in MA for 2000-01
× 100
Hence, option (c).