CAT 1998 — DILR Question 20
Bar GraphsEasy
Passage / Data
Direction: Answer the questions based on the following information.
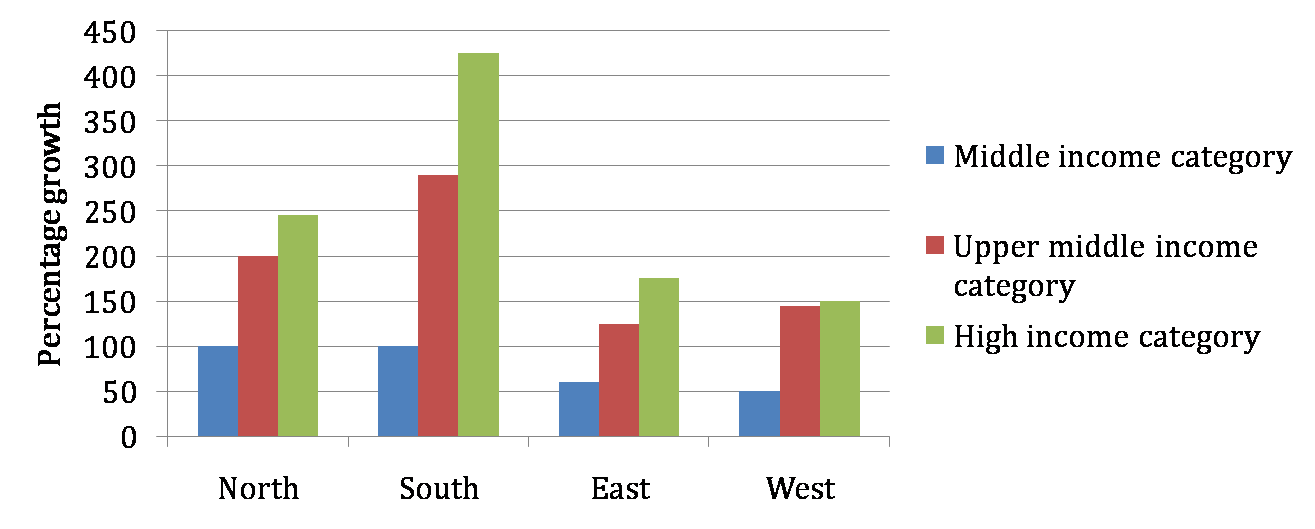
The following bar chart gives the growth percentage in the number of households in middle, upper-middle and high income categories in the four regions for the period between 1987-88 and 1994-95.
 âââââââ
Which region showed the highest growth in number of households in all the income categories for the period?
Answer & solution
- A
North
South
- C
West
- D
None of these
Solution
It can be seen from the graph that the southern region showed the highest growth in number of households in all the income categories for the period.