CAT 1998 — DILR Question 21
Bar GraphsEasy
Passage / Data
Direction: Answer the questions based on the following information.
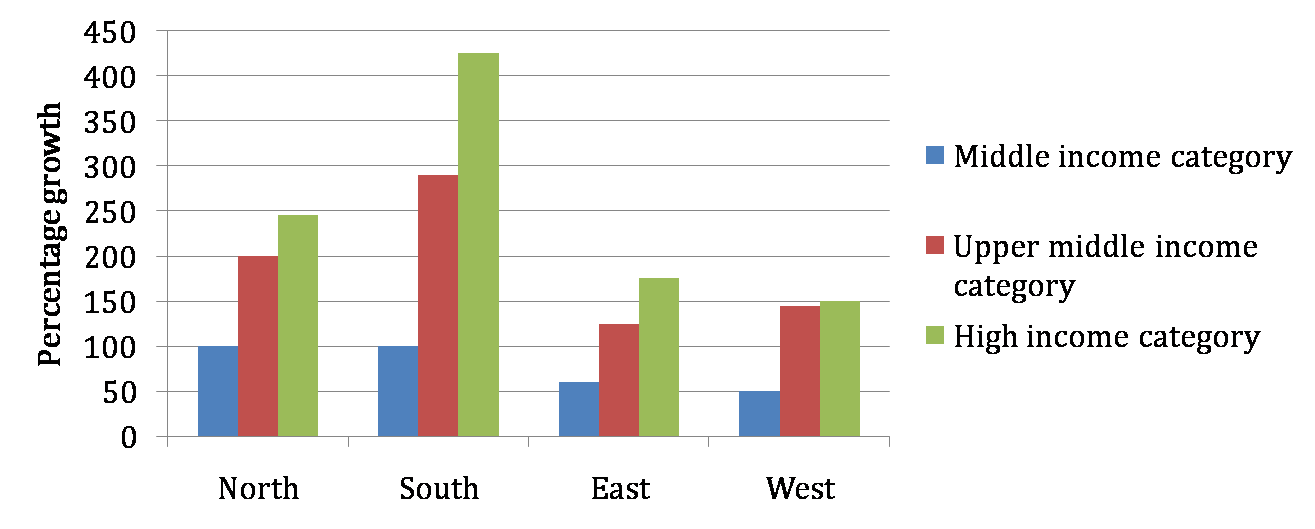
The following bar chart gives the growth percentage in the number of households in middle, upper-middle and high income categories in the four regions for the period between 1987-88 and 1994-95.
 âââââââ
What was the total household income in northern region for upper-middle class?
Answer & solution
- A
Rs. 50 lakh
- B
Rs. 500 million
- C
Rs. 300 million
Cannot be determined
Solution
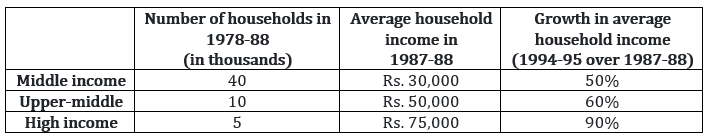
We only know the total number of households for all four regions combined. Nowhere have they given the region-wise break-up of this value. In the light of this, the given question cannot be answered.