CAT 1998 — DILR Question 24
Direction: Answer the questions based on the following information.
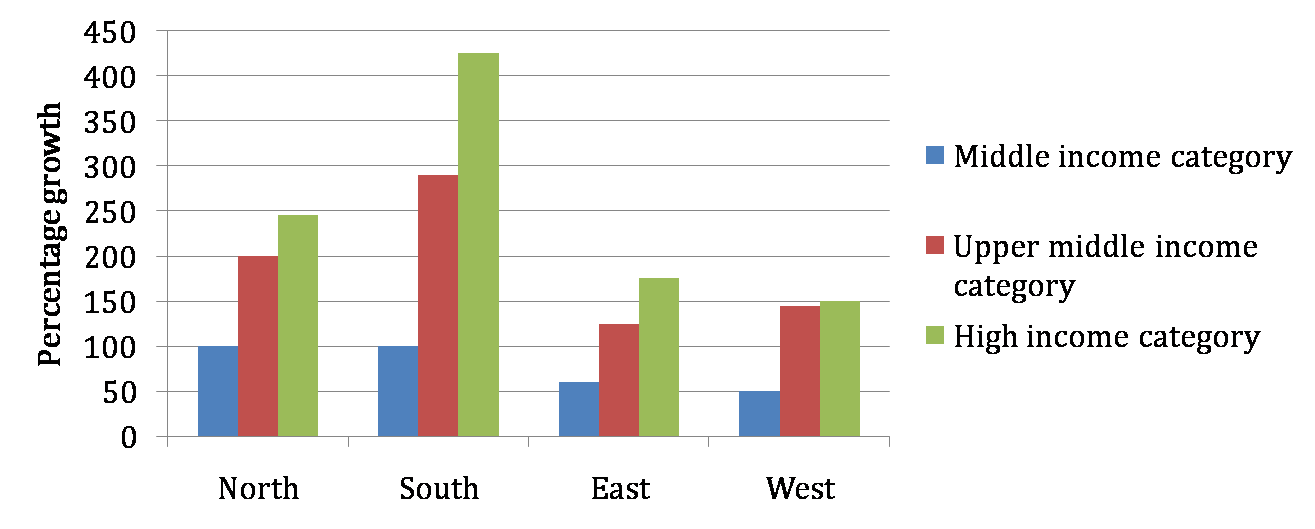
The following bar chart gives the growth percentage in the number of households in middle, upper-middle and high income categories in the four regions for the period between 1987-88 and 1994-95.
 âââââââ
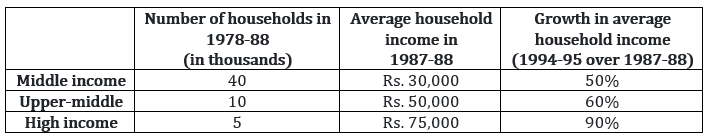
Additional direction: The numbers of households in each category were equally distributed in all the regions.
The ratio of total income for the high-income category to the upper-middle class increased by how much percentage in the given period?
Answer & solution
- A
20%
36%
- C
25%
- D
Cannot be determined
The total income of high income category in 1987-88 is Rs. (5000 × 75000).
The total income of upper-middle class category in 1987-88 is Rs. (10000 × 50000).
Hence, the current ratio of their total incomes = 3 : 4 = 0.75
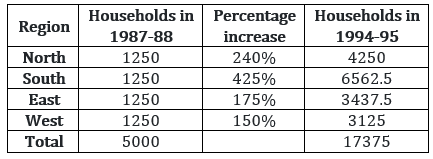
Since the number of households in each category were equally distributed in all regions, we can have the following table for high income category.
 âââââââ
The average household income for high-income category increased by 90%. Hence, average household income for this category in 1994-95 = (75000 × 1.9) = Rs. 1,42,500
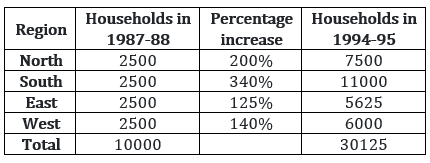
Hence, the total income for high-income category in 1994-95 = (17375 × 142500) = Rs. 2,476 million The same table can be drawn for upper-middle class category as follows:âââââ
 âââââââ
The average household income for upper-middle class category increased by 60%. Hence, the average
household income for this category in 1994-95 = (50000 ×1.6) = Rs. 80,000
Hence, the total income for high-income category in 1994-95 = (30125 × 80000) = Rs. 2,410 million Hence, the ratio of total income for these two categories in 1994-95 =
Hence, percentage increase in ratio