CAT 1998 — DILR Question 25
Bar GraphsEasy
Passage / Data
Direction: Answer the questions based on the following information.
The following bar chart gives the growth percentage in the number of households in middle, upper-middle and high income categories in the four regions for the period between 1987-88 and 1994-95.
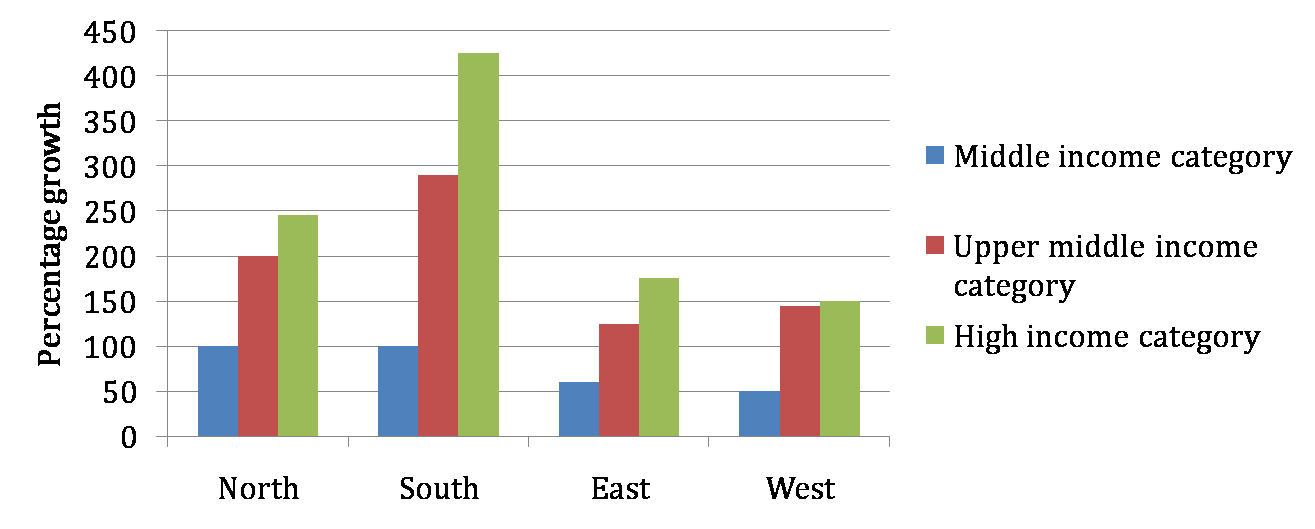

Additional direction: The numbers of households in each category were equally distributed in all the regions.
The average income for the northern region in 1987-88 was
Answer & solution
Correct answer: Rs. 37,727
Rs. 37,727
- B
Rs. 37,277
- C
Rs. 35,000
- D
Cannot be determined
Solution
For northern region, we can draw the following table for 1987-88.
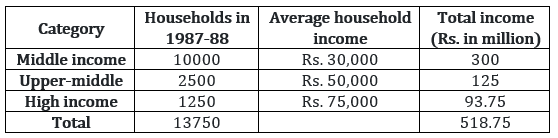
Hence, the average income for northern region
= Rs. 37,727
Related Bar Graphs questions
- Which region showed the highest growth in number of households in all the income…
- What was the total household income in northern region for upper-middle class?…
- What is the percentage increase in total number of households for the northern r…
- What was the average income of the high-income group in 1987-88?…
- The ratio of total income for the high-income category to the upper-middle class…
- What is the minimum number of units that need to be produced to make sure that t…